About Safari Developer Tools
Safari 4.0 and later includes built-in tools to help you prototype, analyze, debug, and optimize websites and web applications. Safari 5.0 and later has additional tools you can use to enable, develop, test and debug Safari extensions.
If you develop websites, web applications, or browser extensions, you should learn about Safari’s built-in developer tools.
At a Glance
Safari has tools for prototyping HTML, CSS, and JavaScript, tools for interactively inspecting and debugging elements, attributes, properties, and styles, an integrated JavaScript debugger, and optimization tools such as a latency and download timeline and a JavaScript profiler.
These tools are built into Safari on the desktop (Mac OS X and Windows) and you can enable them in other Webkit-based applications. A subset of the tools are available in Safari on iPhone OS (iPhone, iPad, and iPod touch).
Enable the Developer Tools in Safari Preferences
You enable the developer tools Safari Preferences, as illustrated in Figure I-1.
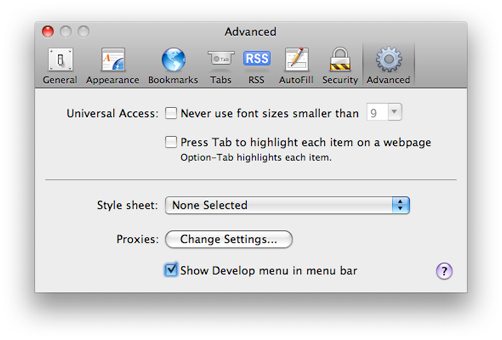
On Mac OS X or Windows, use Safari Preferences to show the Develop menu in Safari, with the full set of developer tools available from the menu.
On iPhone OS, use Safari Preferences to add an error console to Safari. For details, see “Enabling and Using Developer Tools in Safari on iPhone OS.”
You can add the developer tools to other Webkit-based applications as a contextual menu by modifying the application’s
.plistfile. For details, see “Enabling Developer Tools in WebKit-Based Applications Other Than Safari.”
Speed Up Prototyping by Interactively Testing for Errors
Show the Error Console while prototyping your website to quickly spot HTML and JavaScript structure and syntax errors. The Error Console shows you errors and warnings, highlights the line number of the problem in your source file, and tells you how Safari dealt with the error (by ignoring an extra closing tag, for example). For details, see “Using the Error Console,” “Viewing Errors,” and “Using the Error Console to Prototype JavaScript.”
Safari also comes with a Snippet Editor, where you can type in HTML and JavaScript snippets and see them evaluated interactively. No more having to create a dummy HTML page to test an element or a JavaScript function—just type in the part you’re working on and see the results. When it works as you want it to, copy and paste into your actual webpage. For details, see “Using the Snippet Editor.”
If your website has different code paths for different browsers, have Safari give different user-agent strings to test the code branches—verify the behavior changes for Safari, Internet Explorer, Opera, Chrome, or Safari on iPhone OS without having to switch browsers, operating systems, or devices. When you’re ready to open your website in another application, make the switch from inside Safari, without having to quit, open another application, and navigate to your site. For details, see “Changing the User Agent String” and “Switching To Another Application.”
Relevant Chapter: “Prototyping Your Website”
Debug Your HTML and CSS Interactively Using the Web Inspector
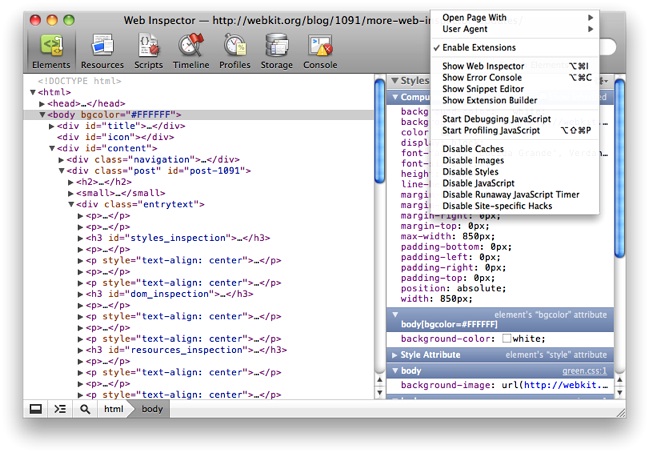
The Error Console finds and identifies syntax and structural errors, but sometimes your website doesn’t look or behave as you want, even though all the syntax and structure is legal. That’s when you need the Web Inspector. The Web Inspector shows you the DOM as it exists in memory—for a static HTML page, that’s often identical to the page source, but for websites that modify the DOM using JavaScript and CSS, it can be very different.
Find Things Fast
Hover over an element in the DOM and it’s highlighted in the browser window. Control-click or right-click on something in the browser window, choose Inspect Element from the contextual menu, and the element is highlighted in the DOM.
Change Things on the Fly
Click an element in the DOM and see its attributes, styles, metrics, and properties, as well any event listener functions attached to it. Double click the element to add, delete, or edit attributes interactively. Click the value of a style, property, or metric to modify or disable it. Increment or decrement numeric values using the cursor keys, in steps of 0.1, 1, or 10. Right-click or control-click to edit the DOM as if it were HTML in a text editor. Any changes you make are shown immediately in the browser window.
Get it Working in the Browser Before You Change the Source
Make changes without affecting your website, or modify any website inside the browser to better understand how it works or how you could adapt it to your needs. Find problems and fix them on a live website without making a copy to a new site or modifying your production site’s source code. Copy and paste the modified code into your source after it’s fully tested and works exactly the way you want it to.
Relevant Section: For details, see “Debugging HTML and CSS Using the Web Inspector.”
Use the Web Inspector and Console to Debug JavaScript Interactively
The Web Inspector and the Console work together to help you find and fix problems in your JavaScript—set breakpoints, pause, inspect variable values, see the call stack, log messages and data to the console, set variable values and continue, enter JavaScript on the fly to test it—all with auto-completion of function, property, and variable names to speed you along.
See It All
The Web Inspector shows all the JavaScript sources—inline functions in the HTML, included
.jsfiles, output from server-side scripts, and code generated on the fly by other code. All the resources are listed. Click a resource in the list to see the working code.Pause Execution When You Want
Click in the gutter anywhere in the code display to set a breakpoint, without having to edit the source. Set conditional breakpoints. Disable breakpoints and re-enable them with a click. Pause any time with a mouse click, without setting a breakpoint.
Continue When and How You Like
Check the call stack, examine variable values, and change values while paused, enter and execute test code, then continue, optionally stepping through the code function by function. Step over functions or step out of a function at will.
Use the Interactive Console
Safari implements the same Console API as the popular Firebug debugger. Add test code to your scripts to log branches in the code or print variable values on the fly, without pausing or setting breakpoints. You can have multiple independent consoles to monitor interaction between windows or tabs. Type commands in the console, with helpful auto-completion, and see the results immediately.
Relevant Sections: “Debugging JavaScript Using the Web Inspector,” “Using the Console to Debug JavaScript.”
Get Help with Cookies, Local Storage, and HTML5 Client-Side Databases
Use the Web Inspector’s Storage panel to inspect cookies, local key/value storage, and even client-side relational databases created with HTML5. All local data is displayed in editable data grids. You can perform actions or enter data in the webpage and see the results in the grid, or enter data interactively in the grid itself. Issue SQL queries right from the Web Inspector, with auto-completion of SQL functions and database field names.
Relevant Section: “Analyzing Client-Side Storage, Databases, and Cookies”
It Works—Now Make It Fly
Once your site is working as it should, you may be understandably reluctant to make changes to optimize performance. Fear not. The Web Inspector’s Resource and Timeline panels show you exactly where time is spent, so you know where bottlenecks are before you change anything.
Once you know exactly where the bottlenecks are, you can make changes interactively without leaving Safari, optimizing your site—and fixing any problems that may cause—before you modify your working source.
The Resources panel shows all the resources your site uses—HTML files, JavaScript files, CSS stylesheets,asp output, images, and media files—in a timeline view, showing when each resource was requested, the latency for each request, when the first byte of the resource arrived, and when the resource finished loading. See at a glance if your website is being hung up by a slow server script, bandwidth-choking file sizes, network latency problems, or unexpected dependencies such as a resource that is not requested until after a script executes.
The Timeline panel lets you profile your website in real time, showing not only the latency and load time for each resource, but the time spent executing scripts and rendering the output. Complex interactions—a script that changes the DOM, causing a resource to load, and a table to be re-rendered, for example—are laid out in a clear and easy to understand fashion.
Relevant Sections: “Optimizing Download Time,” “Optimizing Loading, Scripting, and Rendering Times.”
If the timeline shows that significant time is being spent in your scripts, use the Profiles panel to see where in your script the time is being spent. Moving a single function call from the inside of a loop to the outside of the loop can sometimes have a tremendous impact. Running a profile takes the guesswork out of optimizing JavaScript. A profile shows you how much time is spent in each function, including dependent functions, and how many times each function is called.
See the output in milliseconds or percent of execution time. Sort by execution time. Then spend your effort optimizing code that you know is going to make a significant difference—modify only functions that take a proportionally long time to execute or functions that are called many times.
Relevant Section: “Optimizing JavaScript”
Be a Power User
The Safari developer tools include dozens of keyboard and mouse shortcuts to speed up common operations, from opening the Web Inspector to cycling through auto-completion suggestions. See the shortcuts table in “Keyboard and Mouse Shortcuts” to give your productivity a boost.
Enable, Build, and Debug Extensions
Extensions are a new feature in Safari 5.0. Because they’re so new, they are disabled by default, and are enabled in the Develop menu—making them a developer feature for Safari 5.0.
Once you enable extensions, you can use Extension Builder to create them. You need to join the Safari Developer Program to create extensions—you can’t install an extension without a signed certificate. Go to developer.apple.com to join the program.
When you’re ready to build an extension, read Safari Extensions Development Guide, and refer to Safari Extensions Reference. If you’ve already developed extensions for other browsers, see Safari Extensions Conversion Guide for time-saving tips.
Once you’ve built and installed an extension, you can use the Web Inspector to debug and optimize it.
Injected scripts and stylesheets are inspected and debugged exactly as if they were downloaded from the webpage’s host.
Extension bars can be inspected and debugged by right-clicking or control-clicking on the extension bar and using the contextual menu.
A global HTML page can be inspected and debugged by clicking Inspect Global Page in Extension Builder (the button is present only if the selected extension is installed and has a global page).
Each webpage, extension bar, and global page has its own console. The full set of developer tools for inspecting, modifying, and optimizing HTML, CSS, and JavaScript works on extensions.
Note: When inspecting storage, remember that the domain for the global page or extension bars is the extension, but the domain of injected scripts is the domain of the webpage the script is injected into.
See Also
Safari Extensions Development Guide—step-by-step directions for creating Safari extensions using Extension Builder
Safari Extensions Reference—the JavaScript classes, methods, and properties you can access from Safari extensions
Safari HTML Reference—the supported HTML tags for Safari
Safari CSS Reference—the supported CSS tags for Safari
Safari Web Content Guide—guidance for developing web content for the iPhone
Web Page Development: Best Practices—Apple recommendations for webpage development
WebKit DOM Programming Topics—articles on using and modifying the Document Object Model
WebKit DOM Reference—syntax rules for working with the DOM for Safari and other WebKit-based applications
Last updated: 2010-06-21