Optimizing Your Website
The final step in website development is optimization—making your website load and your scripts run as quickly and responsively as possible. Safari has two tools designed to help you: a visual download analyzer and a JavaScript profiler.
Optimizing Download Time
Open the Web Inspector. Click Resources in the toolbar to see a list of resources that make up the website: HTML, CSS, and JavaScript files, images, XMLHttpRequests, and so on, as shown in .
Note: If resource tracking is not enabled, you are prompted to enable it, either for this session only or always. You can toggle resource tracking on and off by clicking the checkmark button in the bottom bar.
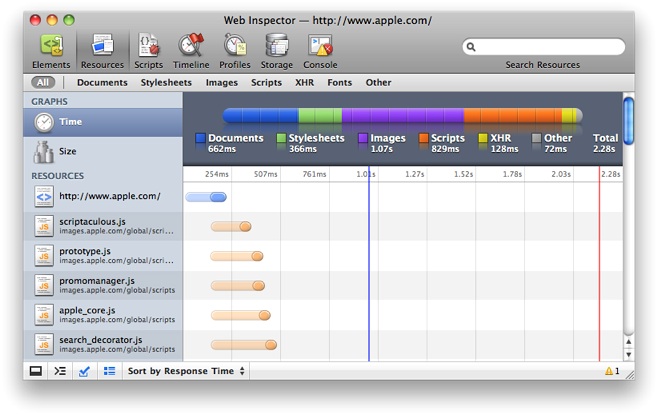
All the resources used in the website are shown in a list on the left. On the right, they are displayed graphically and color-coded by type—documents are blue, style sheets are green, images are purple, XHR resources are yellow, and so on.
The graph shows you when each resource was requested, the combined network and server delay, and the load time for each resource.
The blue line is when the DOMContentReady event is dispatched. The red line is when the body onload event is dispatched.
You can display the resources graphically by size or time. If displayed by size, they are sorted from largest to smallest. You can choose to sort by the transfer size (Transfer) or uncompressed size (Size), as some resources by be compressed for transmission.
If displayed by time, you can sort in several ways:
Start time—the time at which the resource is requested.
Response time—the time at which the first byte of the resource is received.
End time—the time at which the last byte of the resource is received.
Duration—the length of time the resource takes to load.
Latency—the delay between requesting the resource and getting the first byte.
No matter which way you sort, each resource appears as a lozenge whose left edge shows the request time. The lozenge is translucent during the latency, then opaque for the duration (from the response time to the end time).
If your website is slow to appear, use this pane to see why. You can see immediately if the delay is caused by a server-side script that is not responding promptly, a large resource that takes a long time to load, or a script that takes a long time to execute prior to requesting another resource.
You can also use this pane to scan for resources that are not loading at all, such as missing style sheets or requested resources that are misspelled.
You can click any resource in the list to inspect that resource more closely. Exactly what you see depends on the type of resource.
Clicking a document resource, such as a CSS, HTML, or JavaScript document, displays the source code for the document with line numbers. Resources that are not documents, such as XMLHttpRequests, display the data that was delivered to the browser with line numbers.
You can choose to view the contents of the resource or the header information. If you choose Headers, the number of request and response headers associated with the resource is listed. You can choose to display the request and response headers by clicking the disclosure triangle, as shown in “Inspecting resources.”
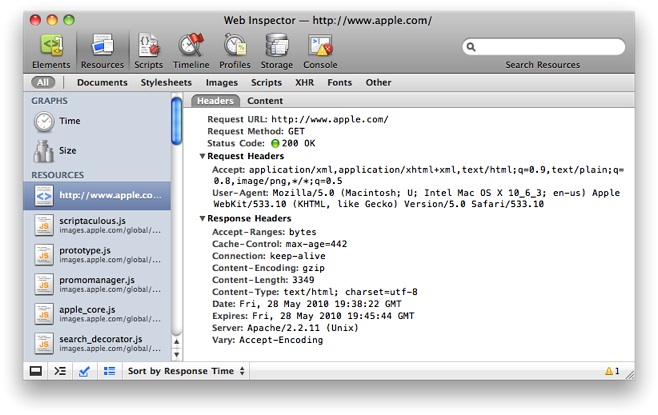
Clicking an image resource displays the image, its dimensions, file size, and MIME type. The request and response headers are also enumerated and inspectable.
Note: Values sent in XHR requests are also shown here; you may find this useful when debugging AJAX sites.
Optimizing Loading, Scripting, and Rendering Times
Not all of the time taken to display a webpage is used to load resources. Considerable time can be spent rendering the webpage and running scripts. There can be complex interactions where a resource needs to load before a script executes, modifying the DOM before it can be rendered.
To get a detailed look at exactly where time is being spent on your website, including dependencies, select Timeline in the Web Inspector.
Capturing a timeline is similar to capturing a JavaScript profile. Click the black record button in the botom bar to start recording events, then click it again to stop recording. The recorded events are shown in a timeline, with time spent loading, scripting, and rendering broken out separately. For an example, see Figure 4-3.
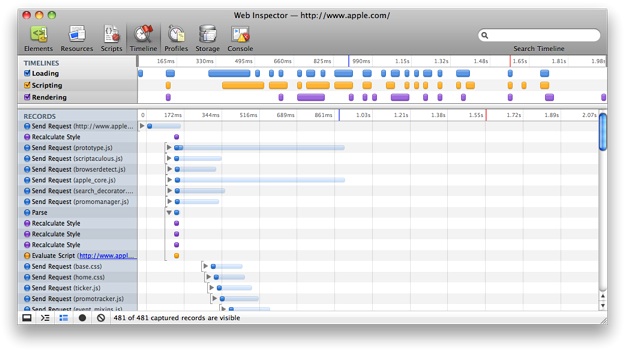
The window has a TIMELINES section and a RECORDS section. Click and drag in the TIMELINES section to zoom in on the records for that period of time.
Clicking a record shows a popup with its name and details. Each record includes a disclose triangle if it contains sub-records. For example, a request event might wait for a reply, and a parse event might have to recalculate styles—waiting for the reply and recalculating styles would be dependent sub-records. The solid portion of a record is the time spent at the top level—the translucent portion shows time spent in the cascade of dependent events.
The blue tool in the bottom bar toggles visibility of records that are under 15 msec.
Optimizing JavaScript
Clicking the Profiles button in the Web Inspector opens the Profiles pane. This pane allows you to see where execution time is being spent in your JavaScript. Use the Profiles pane to find bottlenecks in your scripts and optimize their performance.
Note: If profiling is not enabled, you are prompted to enable it, either for this session only or always. You can toggle profile enabling on and off by clicking the checkmark button in the bottom bar.
To use the Profiles pane, you must start profiling, either manually or by including a console.profile() call in your script. To start profiling manually, click the record button (black circle) in the bottom bar. The record button turns red. To stop the profile, click the record button again. No profile is displayed until you stop profiling, either manually or through a call to console.profileEnd(). Each time you begin and end profiling, another profile is captured.
The Web Inspector’s JavaScript profiler is fully compatible with the Firebug functions console.profile() and console.profileEnd(), but in Safari you can optionally specify a title in console.profileEnd() to stop a specific profile if multiple profiles are being recorded.
Once you have captured one or more profiles, they are listed on the left side of the Web Inspector. Manual profiles are named sequentially (Profile 1, Profile 2, and so on). Profiles created by calls to console.profile() are named with the title of the profile provided in the script. If multiple profiles are captured under the same name, a disclosure triangle reveals multiple runs within the profile.
The time spent in each function executed during the profile is displayed, as well as the number of times each function is called, as shown in “The profiles pane.” The time can be displayed either as a percentage of total time or in milliseconds, toggled by the % button in the bottom bar.
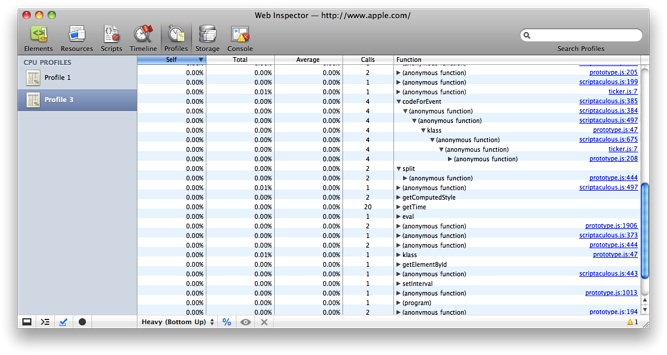
Clicking a profile name displays the functions that were executed during the profile, the time spent in each function, and the number of times each function was called. The time spent is broken down into three categories: Self, the total time spent in the function itself; Total, the total time spent in the function and any subordinate functions it calls in turn; and Average, the average time spent in the function itself during each call (the Self time divided by the number of calls).
You can toggle between absolute time or percentage of total time in the profile by clicking the percent button in the bottom bar.
If a function is declared with a name, the function name is displayed. If a function is created programmatically by an eval() statement or inline <script> </script> tagset, it is labeled (program) in the profile. Other unnamed functions, for example a function defined within a variable declaration, are labeled (anonymous function).
Note: To assist yourself in debugging, assign a displayName to this kind of otherwise anonymous function. The displayName is used as the function name in profiles.
Where applicable, the source URL and line number of the function declaration is shown in grey to the right of the function name. The source URL is a link. Clicking it opens the source in the Resources pane, scrolled to the line number where the function is declared.
There are two ways to view a profile: bottom up (heavy) or top down (tree). Each view has its own advantages. The heavy view shows you which functions have the most performance impact and the calling paths to those functions. The tree view gives you an overall picture of the script’s calling structure, starting at the top of the call stack.
Below the profile is a pair of data-mining controls to facilitate the dissection of profile information. The focus button (eye icon) filters the profile to show only the selected function and its callers. The exclude button (X icon) removes the selected function from the profile and charges its callers with the excluded function’s execution time. While any of these data-mining features are active, a reload button is available that restores the profile to its original state.
The Profiles pane supports plain text searches of function names and resource URLs. Numeric searches are also supported that match rows in the profile’s Self, Total, and Calls columns. To facilitate powerful numeric searching, there are a few operators and units that work to extend or limit your results. For example you can search for “> 2.5ms” to find all the functions that took longer than 2.5 milliseconds to execute. In addition to ms, the other supported units are s, for time in seconds, and %, for percentage of time. The other supported operators are < , <=, >= and =. When no units are specified, the Calls column is searched.
Last updated: 2010-06-21