Prototyping Your Website
The first step in designing a website is primarily esthetic—how do you want it to look and feel? The next several steps are technical—can you achieve what you want using a given combination of HTML, CSS, and JavaScript? Does a particular JavaScript function do what you need? How does applying a specific CSS style affect the page? Does the combined set work on the browsers and platforms you want to support?
The Safari developer tools can help you answer the technical questions in a streamlined and efficient manner.
The Prototyping Process, Improved
It’s common to prototype a website by creating a combination of HTML, style sheets, and scripts, load the combination into a browser, see problems, modify the source—or multiple sources—then reload the page to see the results. It's a cumbersome and sometimes painful process.
It’s inefficient to create a complete webpage before you can test any part of it, then test it using several browsers, rewriting and reloading the page each time you find an error, going back and forth between your HTML, CSS, and JavaScript sources. If your webpage contains a hidden error, and different browsers deal with the error differently, it can be frustrating to find the problem.
Safari can help.
Use the Snippet Editor to interactively test elements of your page in a sandbox, debugging your syntax and testing different atributes and elements without going through the process of creating a whole website. Test the snippets first—set an HTML attribute, apply a CSS style, call a JavaScript function—and see the results immediately, then build your prototype website using a combination of parts that you already know work.
Once you have a prototype, load it in Safari and use the Error Console to spot hidden errors that Safari is dealing with for you—other browsers may deal with them differently, resulting in a different experience. Correct the errors to maximize your chances of compatibility.
If you use the user agent string to execute different code branches that are intended to execute on different browsers, choose User Agent String from the Develop menu to modify the user agent string and invoke the different branches, making sure that each browser is being shown what you intend. Resolve the question of proper code branch versus browser differences in advance.
Finally, you can test your prototype using other browsers or web applications by invoking them directly from the Develop menu in Safari.
Using the Snippet Editor
Choose Show Snippet Editor from the Develop menu to open the Snippet Editor. The Snippet Editor contains an upper pane, in which you can type any combination of HTML, CSS, or JavaScript, and a lower pane that shows how it displays in Safari (or any WebKit-based application), as shown in “The Snippet Editor.”
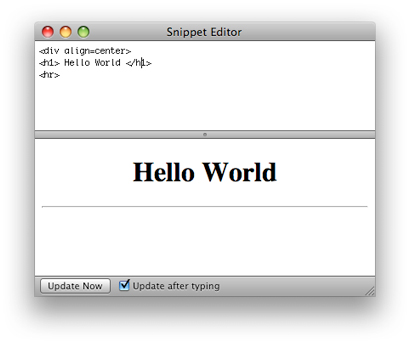
The Snippet Editor provides an interactive interface for quickly prototyping or debugging your HTML, CSS, and JavaScript without having to create complete HTML pages and open them in a browser, or to switch between your editor and browser repeatedly to edit the code and refresh the browser display. Simply type in fragments of code and the display refreshes immediately. When your code produces the effect you want, you can copy and paste it into a working document.
If the "Update after typing" option is selected, the display pane is updated each time you press a key. This is ideal for working with short snippets of HTML or debugging the syntax in a line of JavaScript. For longer snippets, where the display of unfinished code would be distracting, deselect the option and click the Update Now button to refresh the display when you are ready.
Using the Error Console
The Error Console is the most basic tool for debugging a website, so it’s an appropriate tool for prototyping. The Error Console notifies you of any syntax or structural errors that Safari detects in your HTML, CSS, or JavaScript, gives you the location of the error, including the source file and line number, and includes a brief description of how Safari dealt with the error (such as by ignoring an extra closing tag).
Note: Safari on iPhone OS also has an Error Console, although it is more limited. If you are testing content on the iPhone, enable the Error Console as described in “Enabling Developer Tools in Safari on iPhone and iPod Touch.”
Opening the Error Console
There are several ways to open the Error Console. You can choose Show Error Console from the Develop menu, or, if the Web Inspector is open, you can click the Console button (greater-than sign and horizontal lines), press the Esc key, or click the error or warning button in the bottom bar.
The Error Console opens at the bottom of the Web Inspector, as shown in Figure 2-2.

To close the Error Console again, click the Console button in the bottom bar.
Viewing Errors
If any errors or warnings are encountered when loading a website, the number of each is displayed in the bottom bar. Clicking the error or warning button opens the Error Console and displays all of the errors and warnings.
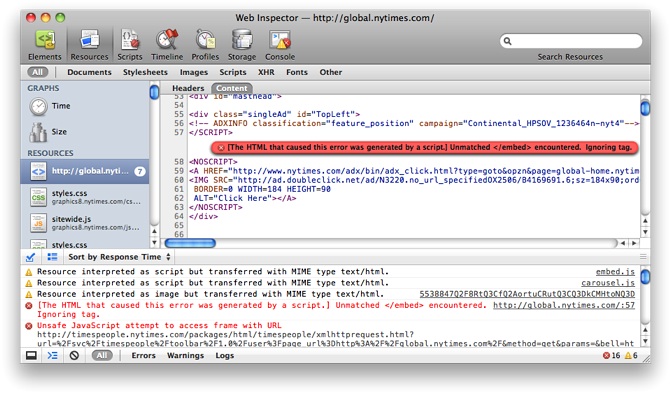
Errors and warnings are shown with a URL link to the resource that generated the problem, the line number (where applicable), and a brief description of how Safari dealt with the problem.
Click the link in the error listing to open the source in the upper pane. The error or warning is also displayed in the source.
Using the Error Console to Prototype JavaScript
Like the Snippet Editor, the Error Console allows you to enter JavaScript interactively and see the results immediately. In addition, a number of console functions can be used to log data to the Error Console (see “Safari JavaScript Console API”).
The console has auto-completion support for JavaScript. As you type, JavaScript variables, properties, and function names are suggested in gray. Pressing the Right Arrow key accepts the current suggestion. If multiple selections begin with the same prefix, you can cycle through the suggestions using the Tab key. If there is only one suggestion, the Tab key accepts it.
Typing a variable name and pressing Enter displays the variable’s current value.
Any changes you make to the DOM using JavaScript from the console are immediately displayed in the Web Inspector’s Elements pane, as well as in the browser window.
Changing the User Agent String
Every browser has a user agent string that identifies its type and version number. The browser sends this string to the server. Your website can also read the user agent string using JavaScript. This is one way to determine what version of which browser a user is running. You can choose what Safari reports as its user agent from the User Agent submenu.
This can be useful to quickly test your code to see if it is reacting to various user agents as you expect, without having to actually load the page in multiple versions of multiple browsers. An example of the User Agent submenu is shown in Figure 2-3.
Note: The browser versions listed in the submenu are updated frequently to reflect current availability.
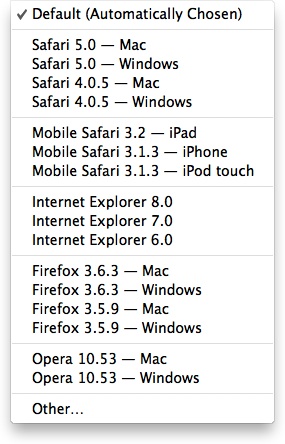
You can choose the common versions of most popular browsers from the submenu. Note that the list includes the versions of Safari found on iPhone, iPad, and iPod touch.
The Other... menu item opens a sheet showing the default user agent string, which you can inspect and edit to any string you like.
If your website has different code branches for different browsers, and loading the site in a given browser reveals problems, one of the first questions is whether the code has actually branched as expected. By changing the user agent string in Safari, you can isolate the code branch from the browser differences. You can also log the code branch to the console and check for it using Safari’s Error Console.
Switching To Another Application
When first testing a website, you typically open it in several browsers, such as Safari, Internet Explorer, and Firefox, to make sure that it works correctly in all cases. The Open Page With command is a convenient way to open the current webpage in another browser, without having to leave Safari, open the other browser, and navigate to the page.
Choose Open Page With from the Develop menu. A submenu is displayed listing all the applications known to the operating system that can open the page.
Last updated: 2010-06-21