Overview of Developer Tools for Safari
There are developer tools built into Safari on the desktop (Mac OS X and Windows), Safari on iPhone OS, and in other WebKit-based applications. These tools can help you to prototype, debug, and optimize your website. This chapter gives a quick overview of how to enable and use these developer tools.
Developing Websites with the Developer Tools
The development process for websites can be accelerated by the Safari toolset at several points. The usual process of development is as follows:
Prototype—Determine what combination of HTML, JavaScript, CSS, and database deliver the functionality you need, testing snippets of code interactively.
Write—Author the website, typically using tools such as Dashcode and HTML editors.
Test and debug—Test using several browsers and platforms (Mac, Windows, iPhone), track down errors and correct them.
Optimize—Make your website more responsive, shorten load times, and improve JavaScript execution.
Once you’ve enabled and familiarized yourself with the developer tools, you can use the Snippet Editor to streamline prototyping, the Error Console and Web Inspector for testing and debugging, and the Web Inspector’s timeline view and JavaScript profiler to help you optimize your website.
Differences Between Safari on the Desktop, Safari on iPhone OS, and WebKit
Safari on iPhone OS (iPhone, iPad, and iPod touch) contains a simple Debug Console that you can enable to help you debug websites and web applications directly from the mobile device.
The toolset for Safari on the desktop (Mac OS X or Windows) is far more extensive. It includes a Develop menu with several commands and a number of interactive tools.
The toolset for WebKit-based applications is essentially the same as for Safari on the desktop, but you enable the tools differently, and the Develop menu is a contextual menu.
Enabling Developer Tools in Safari on the Desktop
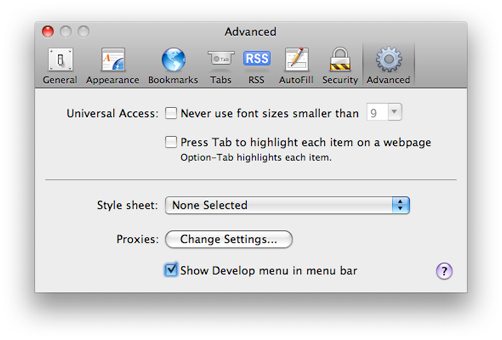
You enable the developer tools in Safari on the desktop (Mac OS X or Windows) by turning on the Develop menu. In Safari preferences, click Advanced, then select "Show Develop menu in menu bar," as shown in Figure 1-1.
Selecting this option adds a Develop menu to your menu bar (Figure 1-2). The Safari developer tools are now enabled.
The Develop Menu Command Summary
The Develop menu contains a set of tools to assist you in prototyping, debugging, and optimizing your website.

Open Page With—Open the current webpage in another application.
User Agent—Browsers send a user agent string that identifies the browser type and version to the server. The same string is sent in response to a JavaScript request for the user agent string. Use this menu item to modify the user agent string Safari sends.
Enable Extensions—Extensions are a new feature of Safari. Because they are new in Safari 5.0, they are disabled by default, and thy can be turned on only in the Develop menu. For the time being, they are a developer feature. For details, see Safari Extensions Development Guide.
Show Web Inspector—Open the Web Inspector window to inspect or modify the DOM, HTML attributes, and CSS properties.
Show Error Console—Open the Error Console window to see any HTML or JavaScript errors and any corrective actions taken by Safari.
Show Snippet Editor—Open the Snippet Editor window to interactively prototype HTML, CSS, or JavaScript snippets.
Show Extension Builder—Open Extension Builder to install, modify, create, or uninstall a Safari extension. For more information, see Safari Extensions Development Guide.
Start Debugging JavaScript—Turn on the interactive JavaScript debugger to set breakpoints, inspect variables, and so on.
Start Profiling JavaScript—Turn on the JavaScript profiler to see how many times each function is called, how long it takes, and so on.
Disable Caches—Turn off caching to see how a website loads the first time.
Disable Images—Turn off image display and view websites as text only.
Disable Styles—Turn off CSS style properties to view the page purely as HTML and JavaScript.
Disable JavaScript—View websites with the JavaScript interpreter disabled.
Disable Runaway JavaScript Timer—Do not prematurely terminate JavaScript functions, no matter how long they take.
Disable Site Specific Hacks—If Apple engineers have modified Safari specifically to work around a problem with your website, use this to disable the modifications to Safari and test your site for correct operation.
Enabling Developer Tools in WebKit-Based Applications Other Than Safari
Applications make use of a .plist file, a set of key-value pairs in the preferences folder, that are used to configure the application. To enable the developer tools in a WebKit-based application other than Safari, set the WebKitDeveloperExtras key to the Boolean value True in the .plist file.
From the command console, type:
defaults write com.myApp WebKitDeveloperExtras bool true
replacing myApp with the bundle identifier of your application.
You must also enable contextual menus in your application. Once this is done, launch the application. The Develop menu can now be accessed by a control-click or right-click from within the application.
Enabling and Using Developer Tools in Safari on iPhone OS
You can enable a Debug Console in Safari on iPhone or iPod touch, which allows you to see HTML, CSS, and JavaScript errors directly on the iPhone or iPod touch. To enable the console, tap the Settings icon, then tap Safari and scroll down to the bottom of the screen, then tap Developer. From here you can turn the console on or off, as shown in Figure 1-3

Once the Debug Console is enabled, Safari records any errors it encounters when accessing a website. A Debug Console report appears at the top of all displayed webpages, as illustrated in Figure 1-4.

If there are no errors, the words “No Errors” are displayed. If any errors are encountered in the HTML, JavaScript, or CSS, the number of errors is displayed, followed by a right-pointing arrow. Tapping the carat brings up the Debug Console.

A scrollable list of errors is displayed. You can choose to see all errors or limit the display to only the HTML, JavaScript, or CSS errors. The line number on which the error occurred is displayed, along with a brief description of the error.
If you choose to see JavaScript errors, you also see JavaScript log events. All output from the JavaScript functions console.log(), console.info(), console.warn(), and console.error() are logged to the Debug Console. By judiciously placing log entries into your JavaScript, you can trace the code path that executes on an iPhone or iPod touch.
Note: Currently, long log entries are truncated to fit the space available on the Debug Console. For best results when using the Debug Console to track JavaScript log events in Safari on iPhone or iPod touch, keep your log entries terse.
Last updated: 2010-06-21