Debugging Your Website
Safari has a number of tools for finding and correcting problems with your website. The best tool for the job depends on what kind of problems you’re experiencing. Basic testing with the Error Console will reveal most syntax and structural problems. More complex problems can usually be resolved using the Web Inspector.
Use Cases
Here are some common cases and the best ways to deal with them.
You have a new website that you’re ready to start testing, or a half-finished website that you’re developing.
See the section on “Prototyping Your Website.” It includes basic testing.
You have a website designed for Internet Explorer on Windows, and you are having trouble making it work in Safari on the desktop or iPhone OS.
Use the Error Console to see if Safari detects any syntax or structural errors in your HTML, CSS, or JavaScript, and if so, what corrective action it is taking. This will also reveal use of extensions that may be proprietary to Explorer.
Note: If Safari reports a tag that works in Explorer as an error, it is not a standard tag, and you need to use an equivalent tag instead, or include a branch in your code that uses one tag for Explorer and another tag for other browsers.
See “Using the Error Console” for a description of basic testing. Start by correcting the reported errors. In most cases, that will solve the problem. If no errors are reported, or you correct the reported errors and problems persist, see the following use cases.
Your website doesn’t work on iPhone, but the Error Console shows no errors.
Enable the Error Console for iPhone or iPod touch (see “Enabling and Using Developer Tools in Safari on iPhone OS”) and check for errors on the device itself. See Safari Web Content Guide for guidance on specific design considerations for iPhone web content.
Your website doesn’t look or behave as you expect, but the Error Console shows no errors.
See the sections in this chapter, “Debugging HTML and CSS Using the Web Inspector” and “Debugging JavaScript Using the Web Inspector,” to learn how to use the developer tools to analyze and debug website behavior.
You are having problems with an HTML5 client-side database.
See the last section in this chapter, “Analyzing Client-Side Database Storage.”
Your website works, but is sluggish or unresponsive.
See the next chapter, “Optimizing Your Website.”
Debugging HTML and CSS Using the Web Inspector
If your website doesn’t look or act as you expect, and the Error Console doesn’t report any errors, analyze your site using the Web Inspector.
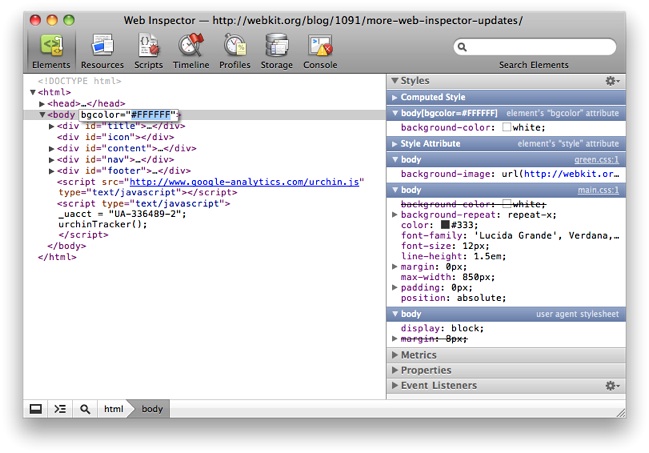
Choose Show Web Inspector from the Develop Menu. This opens the Web Inspector window. Click the Elements button on the Web Inspector toolbar.
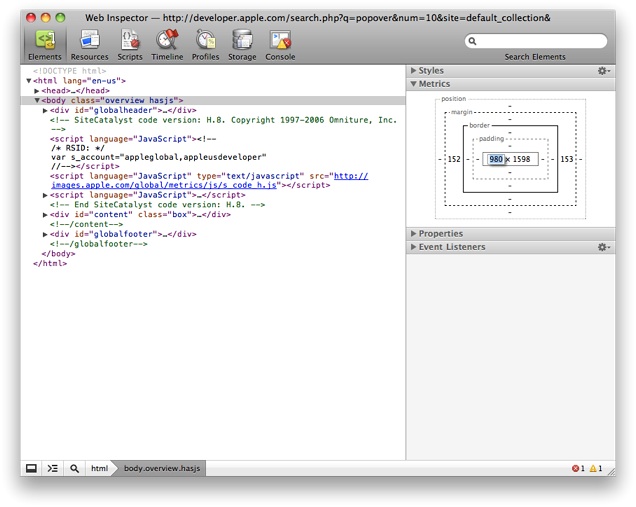
In the Elements pane, the left half of the Web Inspector contains the DOM of the current webpage, as a collapsable and expandable structure of nested elements. Click the disclosure triangle to expand or collapse the view of a given element and its contents. A breadcrumb path is added to the bottom bar, allowing you to see where you are in the DOM hierarchy. You can click a breadcrumb to move back up the hierarchy.
The DOM displayed is the symbolic structure of the webpage that Safari has constructed in memory. In a simple static webpage with no errors, the DOM is identical to the HTML source. In websites where the DOM changes interactively, the Elements pane gives you the current state of the DOM. If there are errors in the webpage, the Elements pane shows you the DOM that Safari has constructed, which may differ significantly from the source.
When you hover over an element in the DOM, the corresponding element is highlighted in the browser window. If you control-click in the browser window, a contextual menu is displayed with an “Inspect Element” choice. Choosing Inspect Element highlights the corresponding element in the DOM. This makes it easy to zoom in on a given element and find its location in the source, even in a complex website.
Note: Another way to get from an element in the browser display to its definition in the DOM is to click the magnifying glass button in the bottom bar, then move the cursor over the browser window. Elements are highlighted as the mouse passes over them. Clicking an element zooms the DOM tree to the element’s definition and highlights it.
The right side of the pane displays the styles, metrics, and properties of the currently selected element.
Using the DOM view along with the styles, metrics, and properties, you can inspect and interactively modify any element on a webpage. More significantly, you can quickly grasp the inheritance structure that gives each element its appearance, placement, and behavior.
When debugging a webpage, it’s typically best to control-click on the part of the page that looks wrong in Safari’s browser window. Then look at the highlighted element in the DOM panel of the Web Inspector to see how the element is defined. You can interactively modify the HTML parameters in the Web Inspector to see how that changes the behavior in the browser window. If the HTML attributes seem correct, check the applied CSS styles by selectively disabling them or modifying them in the Web Inspector. The effects are immediately visible in the browser window. If this solves the problem, copy the modified HTML or CSS and paste it into your source. If not, the problem may be caused by an errant script. See “Debugging JavaScript Using the Web Inspector.”
If you know the name of an element in the DOM that you want to inspect (for example, to find all instances of a particular class), use the search bar in the upper right corner of the Inspector.
Note: In the Elements pane, the search field accepts Xpath and CSS selectors as well as plain text. For example, searches can be conducted as plain text, with an Xpath query using document.evaluate(), and with a CSS selector using document.querySelectorAll(). All search results are highlighted in the DOM tree, with the first match revealed and selected.
The following subsections show how to inspect and modify HTML and CSS using the Web Inspector.
Inspecting and Editing DOM Attributes
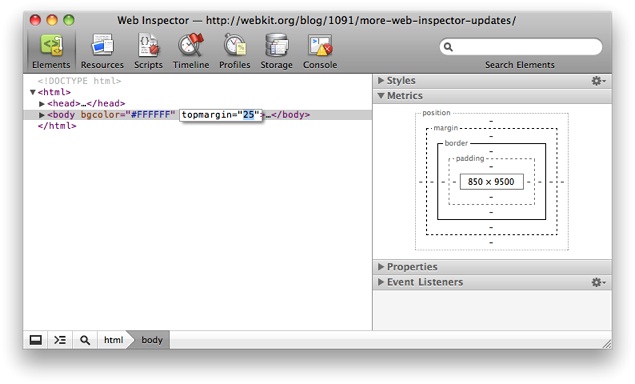
The left pane shows the DOM attributes associated with the currently selected element. Double-click an element name, attribute name, or attribute value to edit it interactively, as shown in “Editing DOM attributes.”
Use the tab key and shift-tab key combination to traverse the attributes.
You can edit values using the letter and number keys as you would expect. For numerical values, you can also use the arrow keys to increment or decrement the value by 1. Holding down the option or alt key increments or decrements the value by 0.1, while holding down the shift key increments or decrements by 10.
Right-click or control-click the element to bring up a contextual menu, as shown in Figure 3-2.
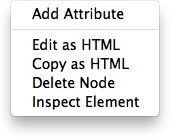
You can add a new attribute to the element, edit the DOM as if it were an HTML file in a text editor, copy the HTML for the element and all its children to the clipboard, of delete the element and all of its children. Choosing Inspect Element in this context allows you to inspect the Web Inspector itself.
Inspecting and Editing Styles
Click Styles in the list on the right, to see the CSS styles that are applied to the currently selected element, as shown in “Viewing styles.”
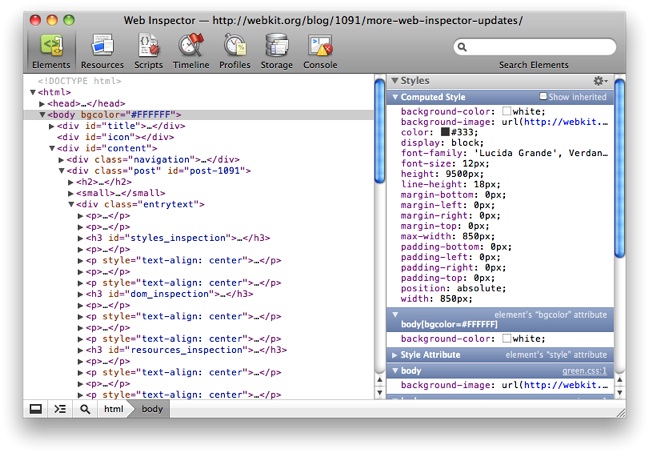
The first section of text in the right pane shows the computed style for the selected element, which is the sum of all inherited and overridden styles specified for that element and its containers. This section is followed by the sections containing the CSS specifications that apply to the element, in hierarchical order. Select the “Show inherited” option to see the inherited default styles being applied as well.
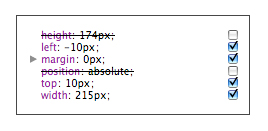
Hovering over an editable style brings up a series of check boxes. Unchecking a box disables the application of that style property. The results are immediately displayed in the browser window. The style is then displayed in strikethrough text, as shown in “Editing style properties.” Re-checking the box enables the style property again.
Double-clicking a style allows you to edit it on the fly and immediately see the difference in your browser window. You can edit properties in a few different ways:
Pressing Delete with the property selected deletes the property, if allowed.
You can edit the property values using the keyboard.
For numerical values, you can use the arrow keys to increment or decrement the value by 1. Holding down the option or alt key increments or decrements the value by 0.1, while holding down the shift key increments or decrements by 10.
You can add style attributes by clicking in the white space or tabbing past the last attribute, or by appending a semicolon to the end of a line and typing in new style attributes.
You can edit a selector by double-clicking it.
You can create a new rule by choosing “Add New Style Rule” from the gear menu.
You can cycle through different color representations—such as
white,#ffffff, orrgb(255,255,255), for example—by clicking on the color swatch beside a color value.
Because style properties are interactively editable, you can modify them until you have exactly the effect you want, before you change a line of source.
Inspecting and Editing Metrics
Click Metrics to see the spatial metrics for a given element—its height and width, along with the height and width of any borders, margins, or padding. Double-click the value of a metric attribute to edit it interactively, as shown in Figure 3-5.
Alternatively, double-click a metric value displayed on the right to edit it directly, as shown in Figure 3-6
Inspecting Listener Functions
If any JavaScript functions have been added as event listeners, you can inspect them by clicking Event Listeners in the right hand pane, as shown in Figure 3-7.

The gear menu gives you the choice of seeing event listeners that have been added to any node or only those added to the currently selected node.
Debugging JavaScript Using the Web Inspector
Choose Start Debugging JavaScript from the Develop menu. Open the Web Inspector and click Scripts in the toolbar to view the Scripts pane
If you do not have JavaScript debugging enabled, you see a prompt to enable debugging when you click the Scripts button. You can toggle debugging on and off by clicking the checkmark button in the bottom bar.
The pause button in the bottom bar causes the debugger to pause on exceptions. The icon turns blue when pause-on-exceptions is active.
Once debugging is active, a pop-up menu of JavaScript sources is displayed, above a listing of the currently selected source, as shown in .
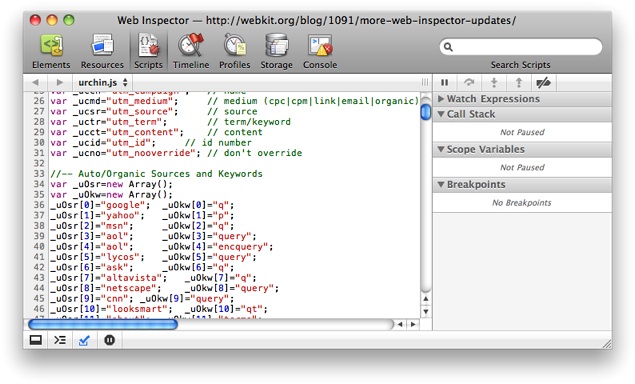
When the source of the script is a JavaScript file, the filename is listed. If the source is in-line JavaScript in an HTML file, the URL of the HTML is listed. If the JavaScript is the result of a string passed through eval( ) or another anonymous source, the resource is listed as “(program)”.
Choosing a source from the pop-up menu displays the listing for that source in the left pane. If the script is not paused, the right pane shows headings for the call stack, breakpoints, watch expressions, and scope variables, but no content is displayed.
You can set a breakpoint in any script by clicking in the gutter by the line number. The script will pause at the breakpoint. The script name, line number, and text of the breakpoint appear in the Breakpoints section on the right of the Web Inspector—clicking a breakpoint on the right jumps the text on the left to the line with the breakpoint. A checkbox allows you to enable and disable the breakpoint without removing it.
Right-click or control-click in the gutter to bring up a contextual menu:
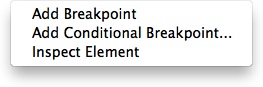
If choose Add Conditional Breakpoint, you are prompted to enter an expression. When execution reaches a conditional breakpoint, the script pauses only if the expression evaluates as true, non-zero, or not null.
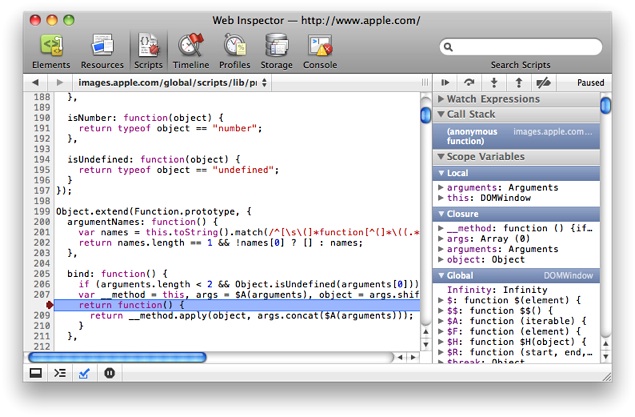
Clicking the pause icon in the toolbar above the right pane also pauses the script. When the script is paused, the line of JavaScript last executed is highlighted and the call stack, breakpoints, watch expressions, and scope variables are displayed, as illustrated in .
Note: The pause/play button on the upper right pauses or resumes the script. The pause button in the bottom bar cycles the debugger through three states:
Black—Do not pause on exceptions.
Blue—Pause on exceptions.
Purple—Pause on uncaught exceptions.
The Web Inspector has a unique feature regarding in-scope variables: It shows closures, “with” statements, and event-related scope objects separately. This gives you a clearer picture of where your variables are coming from and why things might be breaking (or even working correctly by accident).
The pause icon changes to a continue icon when the script is paused. The toolbar above the call stack display has additional controls, allowing you to step past the next function, step into the next function, or step out of the current function. These controls allow you to step through any script, function by function, skipping functions as needed, and examine the call stack and variables at each point.
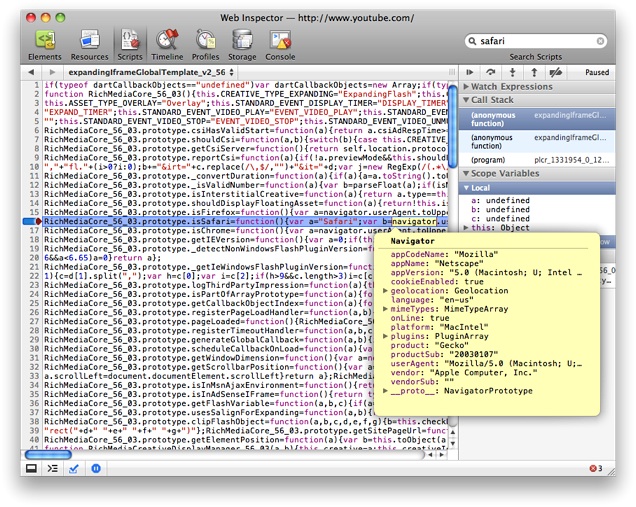
While the script is paused, if you hover over an expression in a script, a popover appears showing the evaluation of the expression, typically the properties of the object, as illustrated in Figure 3-10
You can also use the console to assist in debugging JavaScript.
Using the Console to Debug JavaScript
Click the Console icon to open the Console panel. You have the choice of viewing all console messages, just errors, just warnings, or just log entries.
Note: You can have multiple independent consoles open—one for each window or tab being inspected, as well as consoles for each component of a Safari extension being inspected, such as extension bars, injected scripts, and the global page.
You can use the console to debug JavaScript in two distinct ways:
You can enter JavaScript interactively in the console and see the results immediately.
You can include various
consolefunctions in your JavaScript to log data to the Error Console while the script is running. These functions use the same syntax as the popular Firebug debugger.
Entering JavaScript Interactively
You can enter JavaScript in the terminal interactively to help debug your script. For example, you can call functions defined in the script and see the results; you can evaluate expressions that include variables or functions declared in your script; and you can query the values of variables directly.
This is particularly helpful when used in combination with breakpoints in your code, allowing you to pause and inspect the script interactively at any point.
The console has auto-completion support when entering JavaScript. As you type, JavaScript variables, properties, and function names are suggested in gray. Pressing the Right Arrow key accepts the current suggestion. If multiple selections begin with the same prefix, you can cycle through the suggestions using the Tab key. If there is only one suggestion, the Tab key accepts it.
Typing a variable name and pressing Enter displays the variable’s current value.
Any changes you make to the DOM using JavaScript from the console are immediately displayed in the Elements pane, as well as in the browser window.
The Command Line API
In addition to the usual JavaScript methods, and the functions and variables defined in your script, you can enter some Firebug command line API’s interactively at the console. The following commands are supported interactively:
$0-$4Variables that contain the current and previous three selected nodes in the Web Inspector.
$(id)Returns the element with the specified ID. Similar to
getElementById().$$(selector)Returns the array of elements that match the given CSS selector. Similar to
querySelectorAll.$x(xpath)Returns the array of elements that match the given XPath expression.
clear()Clears the console.
debug(functionName)Adds a breakpoint to the first line of a function.
dir(object)Prints an interactive listing of all properties of the object. Similar to the popover from hovering over an object when a script is paused.
dirxml(node)Prints the XML source tree of an HTML or XML element. This looks identical to the view that you would see in the Elements panel of the Web Inspector. You can click on any node to inspect it in the Web Inspector.
inspect(),Takes an element, database, or storage area as an argument and automatically jumps to the appropriate panel to display the relevant information.
keys(object)Returns an array containing the names of all properties of the object. (Properties are key/value pairs; the name of a property is the key.)
monitor(functionName)Turns on logging for all calls to a function.
monitorEvents(object[, types])Turns on logging for all events dispatched to an object. The optional argument types may specify a specific family of events to log. The most commonly used values for types are "mouse" and "key".
The full list of available types includes "composition", "contextmenu", "drag", "focus", "form", "key", "load", "mouse", "mutation", "paint", "scroll", "text", "ui", and "xul".
profile([title])Turns on the JavaScript profiler. The optional title is a label for the profile.
profileEnd()Stops a running profile.
unmonitor(functionName)Stops logging calls to a function.
unmonitorEvents(object[, types])Stops logging events, optionally events of a particular type, that are dispatched to an object.
values(object)Returns an array containing the values of all properties of the object. The values are returned in the same order as the keys in
keys(object).
To make working with these APIs easier, they are included in the Console’s auto-completion capability.
Safari JavaScript Console API
Safari supports several JavaScript console functions for debugging. As an alternative to setting breakpoints, you can log branches in your code path, print variable values, and so on, using console functions. Safari supports many of the same console functions used in the Firebug API.
Note: You type the Firebug command line APIs interactively in the console. You insert the Firebug console functions into your scripts.
Many console functions take a message-object as a parameter. This message-object is logged to the error console. When Safari logs a message-object, it appends a hyperlink to the line in the source code where the logging console function appears. A message-object can contain a string, one or more variables, or a combination. You can use printf-style string substitution using numeric or string variable values. If variables are included, but not used for string substitution, the variable values are logged, space delimited.
Examples of valid message-objects:
"It got this far..."
"Item and count:", item, count
"Item: %s Count: %d", item, count
"Item: %s Count:", item, count
count
The following console functions are supported in Safari:
console.assert(expression, message-object)If
expressionevaluates false, logs the message.console.count([title])Logs the number of times this line of code has executed, and an optional title.
console.debug([message-object])Logs the message object.
console.dir(object)Logs the current properties of the object.
console.dirxml(node)Logs the DOM tree of an HTML or XML element.
console.error(message-object)Logs an “error” icon followed by a color-coded message object.
console.group(message-object)Logs the message object and begins an indented block for further log entries.
console.groupEnd()Ends an indented block of log entries.
console.info(message-object)Logs the message object.
console.log(message-object)Logs the message-object.
console.log(message-object)Logs the message-object.
console.profile([title])Begins profiling JavaScript—tracking the number of times each function is called, the time spent in that function, and the time spent in nested groups of functions. If a title is provided, the profile is named. See “Optimizing JavaScript.”
console.profileEnd([title])Ends one or more JavaScript profiles. If a title is provided and a running profile has a matching title, only the current run of that profile is ended. Otherwise, the current run of all profiles is ended.
console.time(name)Starts a timer and gives it a name.
console.markTimeline("string")Adds a label to the timeline view marking when the point when the method was called.
console.trace()Logs a JavaScript stack trace at the moment the function is called. The stack trace lists the functions on the call stack (functions that have been called and have not yet finished executing and returned) and the values of any arguments passed to those functions.
console.warn(message-object)Logs a “warning” icon followed by a color-coded message-object.
Note: The functions console.log, console.info, console.warn, console.debug, and console.error all log a message. The only difference between the functions is the color-coding of the log entry and the inclusion of marker icons for warnings and errors.
Analyzing Client-Side Storage, Databases, and Cookies
You can use the Web Inspector’s Storage pane to inspect HTML5 client-side databased, local storage, session storage, and cookies.
Local storage and session storage are displayed as an editable data grid of key/value pairs.
Cookies show the name, value, domain, path, expiration date, and size of each cookie, as shown in Figure 3-11.
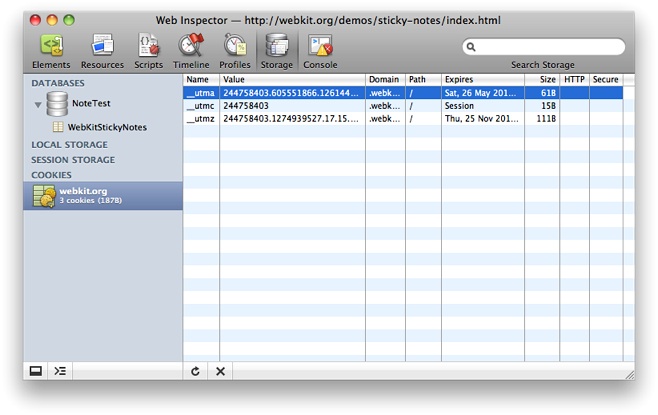
When inspecting cookies, you can see httpOnly cookies and cookies that are sent only over HTTPS in the rightmost columns. Clicking the X in the bottom bar deletes the cookie.
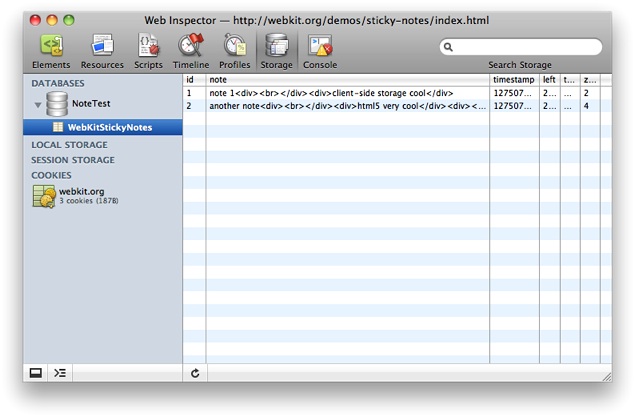
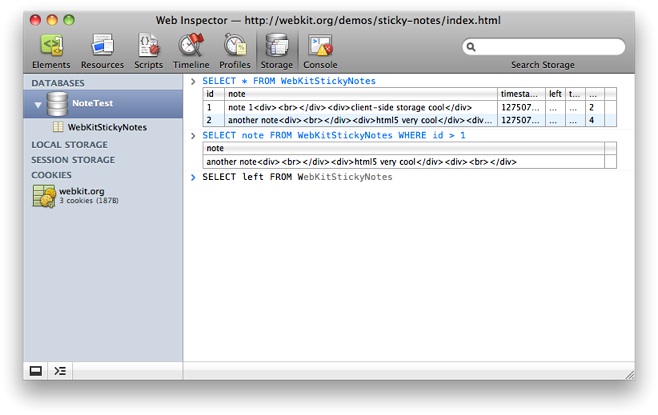
Open databases are shown in the sidebar. Clicking a database’s disclosure triangle shows the database’s tables. Selecting a database table displays a data grid containing all the columns and rows for that table, as shown in Figure 3-12.
In addition to inspecting HTML 5 databases, you can interact with them by issuing SQL queries against any of the displayed databases. Select a database in the sidebar to see an interactive console for evaluating SQL queries. The input to this console has auto-completion and tab-completion for table names in the database, as well as for common SQL words and phrases, as illustrated in “An SQL query.”
Last updated: 2010-06-21