Previous Next

ORS Reports > Tutorial: How to measure the end-user experience

Tutorial: How to measure the end-user experience
A quality end-user experience is perhaps the most important benchmark of a healthy network. Any error, extra latency, or downtime degrades an otherwise positive experience for users. Fortunately, Observer Reporting Server reports can help you visualize these degradations so you can maintain a quality user experience.
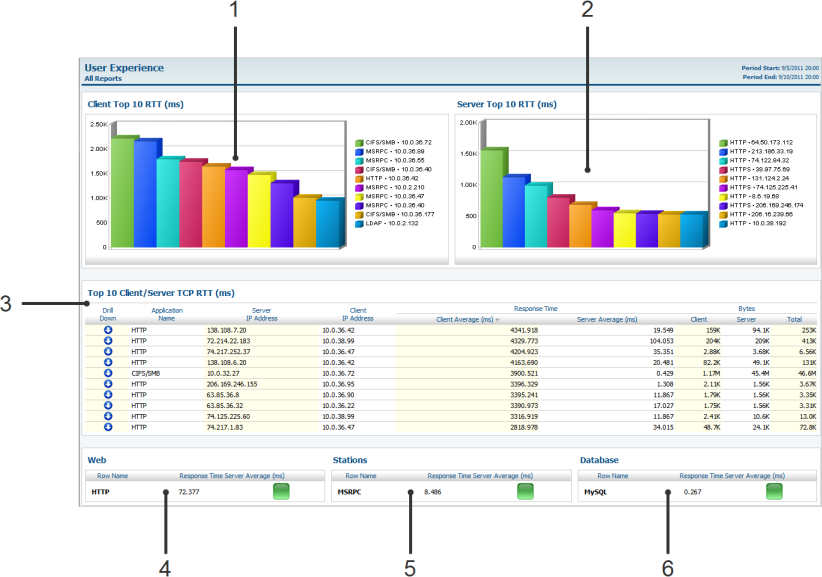
This tutorial guides you through creating a report that measures the end-user experience. Because end-user experience can be affected by hundreds of factors, the report you are creating is not comprehensive. Instead, the tutorial provides you an understanding of how to create your own user-experience report using this as a foundation. Before you begin the tutorial, consider viewing the finished report and its individual components in Figure 1 and its accompanying table.
Figure 6. Finished Example Report
Note: This tutorial only teaches you the concepts of report creation. After you master the concepts, you can create reports that better suit your needs.
Before creating items like graphs and tables, you must create a new report. Reports simply store the report elements that give your report its content. Report elements are graphs, tables, and the like. Create your new report by completing the following steps:
1.
Choose Reports > Business Group Reports.
2.
Click the New button. The Report Setup window appears.
3.
Ensure the General Options tab is selected, and type User Experience in the Report Name box.
4.
(Optional) In the Report Description box, type Report shows top 10 highest client/server RTT, plus multi-tier application response times.