Previous Next

ORS Reports > Tutorial: How to measure the end-user experience > Creating the Web grid

Creating the Web grid
The first part of your report is finished. You created two graphs representing round-trip time, one for clients and another for servers, plus a table blending the two. The table is clickable in the final report, allowing you and other users to see more details.
CAUTION! Your report is only saved after clicking OK in the Report Setup window. While not required, if you want to save your progress before continuing this tutorial, do so now.
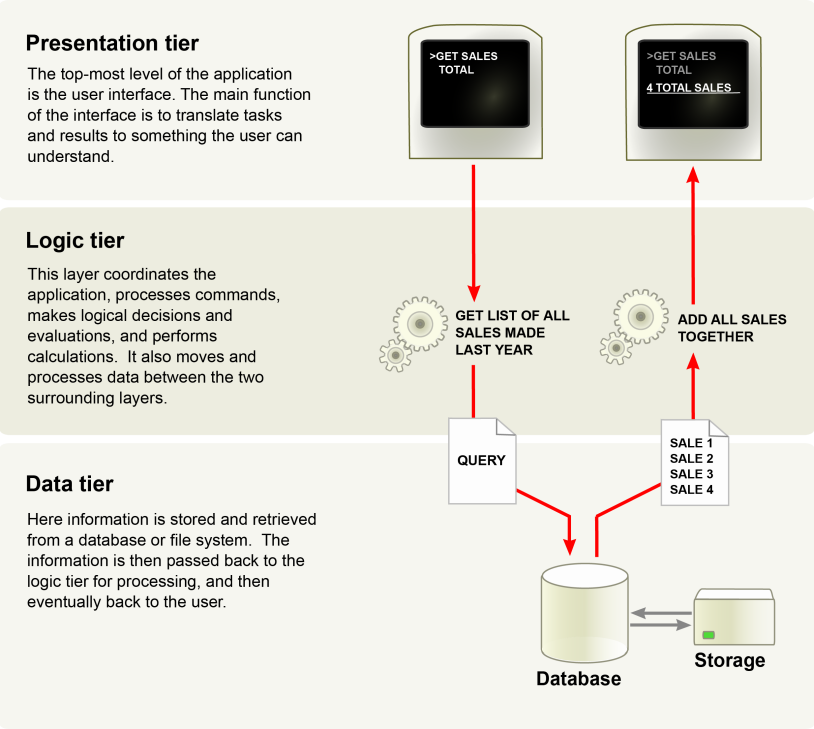
The second part of your report involves using Observer Reporting Server to monitor a multi-tier architecture. A multi-tier architecture is commonly seen with three tiers: presentation, logic, and data. Each tier can experience its own problems, and each problem contributes to a degraded user experience. For more information about multi-tier architectures, see Figure 6.
Figure 11. Understanding Multi-Tier Architecture
In this tutorial, Salesforce.com represents a presentation tier; MSRPC traffic (across the local subnet) represents a logic tier; and a MySQL database server (on the local subnet) represents a data tier. These are only conceptual examples for this tutorial.
Create the first grid for the multi-tier architecture by completing the following steps. Reopen the User Experience report if you saved/closed it. Starting in the Layout tab of the Report Setup window:
1.
2.
3.
Type Web in the Grid Element Title box.
4.
5.
*
*
6.
7.
8.
9.
10.
Type HTTP for the row name.
11.
12.
13.
14.
15.
In the First box, type 204.14.232.1. This IP address and the following encompass the range registered to Salesforce.
16.
In the Second box, type 204.14.239.255 and click OK.
17.
Click OK to confirm your changes. The filter is applied, and you return to the Grid Element Row Setup window.
18.
19.
20.
Click OK to confirm your changes. The grid is successfully added to your report, and you return to the Report Setup window.
21.
Ensure the Web grid is still selected, and click the Down Arrow button once to move the grid below the table. Your report now appears similar to Figure 7.
Figure 12. Web Grid Complete