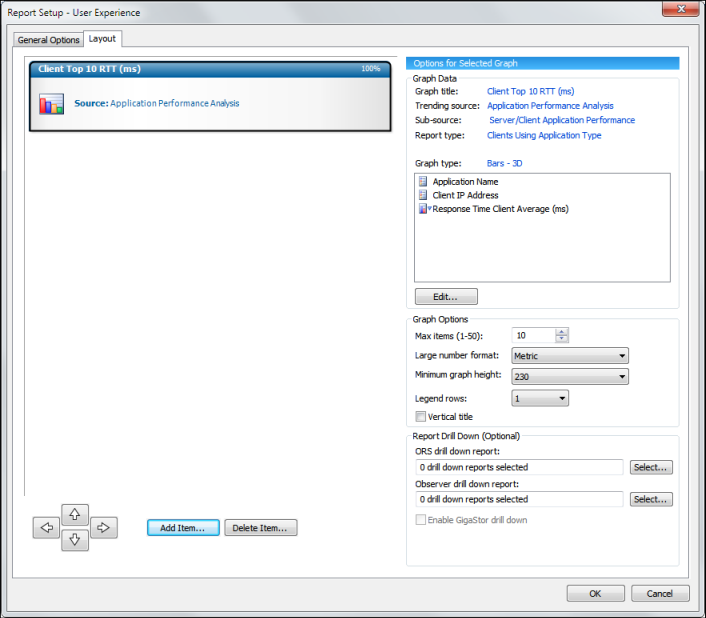
Creating the client graph You created a new report and provided it a descriptive name. The report is ready to have a graph added. Add your first graph by completing the following steps: 1. Click the Layout tab in the Report Setup window. 2. Click Add Item; select Graph; and click OK. The Graph Setup window appears. 3. Type Client Top 10 RTT (ms) in the Graph Title box. 4. In the Data Source Selection area, configure your data source to match the following parameters: Trending Source: Application Performance Analysis Sub-Source: Server/Client Application Performance Statistics Report Type: Clients Using Application Type Graph Type: Bars - 3D 5. In the Available Columns area, double-click General Statistics to expand the list. 6. Select “Response Time Client Average (ms)” to add the column. 7. Click OK to confirm your changes. You return to the Report Setup window. 8. In the Graph Options area, change Max Items to 10 and Minimum Graph Height to 230. Your report should appear similar to Figure 2. Figure 7. Client Graph is Complete