Debugging
You should test your web content on both the desktop and various iPhone OS devices. If you do not have iPhone OS devices for testing, you can use Simulator in the iPhone OS SDK. Because the screen is larger and Safari behaves slightly differently on iPad, you should specifically test your content on an iPad device or by setting the hardware device in Simulator to iPad. You can also simulate iPad-like behavior in Safari on the desktop by changing the user agent string. When testing in Safari on any platform, you can use the Debug Console to debug your web content.
Safari on iPhone OS provides a Debug Console that allows you to debug your web content and applications in Simulator and the device. The console displays errors, warnings, tips, and logs for HTML, JavaScript, and CSS. The console also shows uncaught JavaScript exceptions as errors. This chapter describes how to enable the Debug Console, view the console messages, and print your own messages to the console.
For more tips on debugging web content in Safari, read Safari User Guide for Web Developers. Read the section “Changing the User Agent String” in Safari User Guide for Web Developers for how to simulate iPad-like behavior in Safari on the desktop—select Other from the User Agent submenu and enter the iPad user agent string described in “Using the Safari User Agent String.”
Enabling the Safari Console
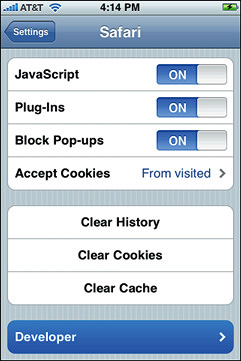
You turn on the Debug Console using the Developer Settings for Safari on iPhone OS as follows:
Click Settings on the main page.
Click Safari.
Scroll down and select Developer as shown in Figure 11-1.
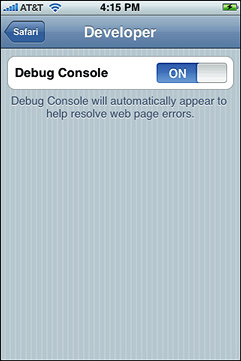
Switch Debug Console to ON as shown in Figure 11-2.
Viewing Console Messages
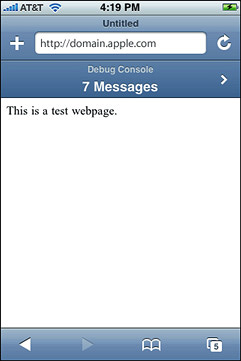
When the Debug Console is on, a banner appears above your webpage if there are messages in the console, as shown in Figure 11-3. Click the banner to view the messages.
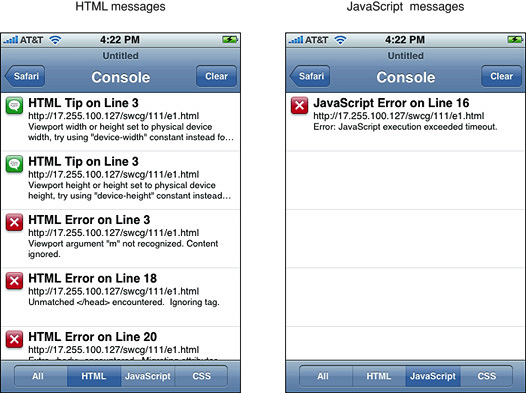
The console displays the messages in the order in which they occur, as shown in Figure 11-4. Each message description contains the type of message, the line number and filename of the document, and the text message. The types of messages are log, info, warning, and error. Click the Clear button to remove all messages from the console.
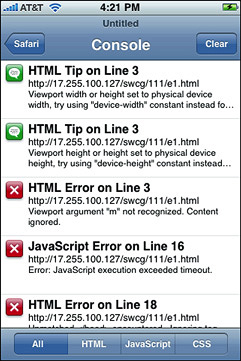
You can also filter the list by HTML, JavaScript, and CSS messages by clicking the respective button at the bottom of the screen. Figure 11-5 shows the HTML messages filtered on the left and the JavaScript messages filtered on the right.
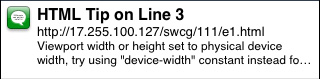
Tips appear in the console if you don’t follow certain guidelines. For example, if you set the viewport width to 320 instead of using the device-width constant, then an HTML tip appears in the console as shown in Figure 11-6. A similar tip appears if you set the viewport height to 480 instead of using the device-height constant.
For example, the following HTML fragment generates the first three HTML messages in the console shown on the left side in Figure 11-5. Syntax errors also generate messages.
<meta name = "viewport" content = "width = 320, height = 480, m = no"> |
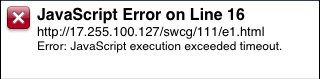
The console catches JavaScript errors too. For example, the following JavaScript code causes a timeout—it contains an infinite loop—and generates the error message shown in Figure 11-7.
<script> |
while (true) a = 9; |
</script> |
Creating Messages in JavaScript
You can print your own messages to the console using JavaScript. You do this by using the console attribute of the window object in JavaScript.
For example, the following code line prints the value of a variable to the console using the log() method:
console.log("x = " + x); |
You can also create your own error and warning messages using the error() and warn() methods as in this code fragment:
<script> |
console.log("My log message goes here."); |
console.warn("My warning message goes here."); |
console.error("My error message goes here."); |
console.info("My information message goes here."); |
</script> |
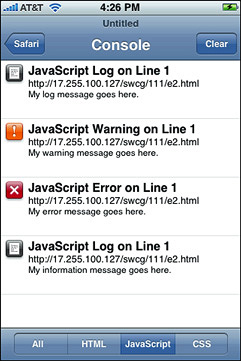
This code fragment generates the console messages shown in Figure 11-8. The info() method is the same as log()—it’s provided for backward compatibility.
Last updated: 2010-03-24