Debugging Applications
This chapter describes the Xcode debugging facilities.
Part of your debugging workflow may require to view or manipulate data your application writes in its file system. For example, you may need to edit the data the application has stored to recreate a particular condition you want to test. See “Managing Application Data” for details about manipulating your application’s data.
Debugging Facilities Overview
Xcode provides several debugging environments you can use to find and squash bugs in your code:
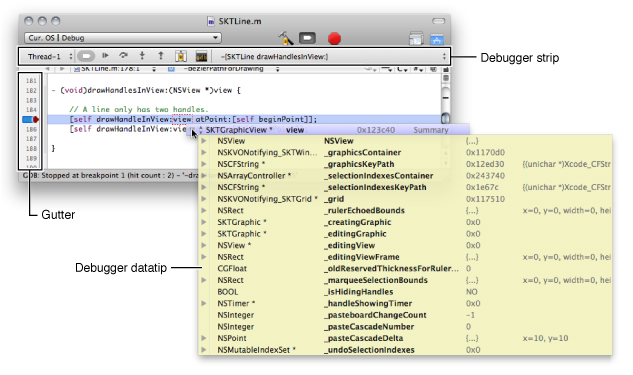
The text editor. The text editor allows you to debug your code right in your code. It provides most of the debugging features you need. You can:
Add and set breakpoints
View your call stack per thread
View the value of variables by hovering the mouse pointer over them
Execute a single line of code
Step in to, out of, or over function or method calls
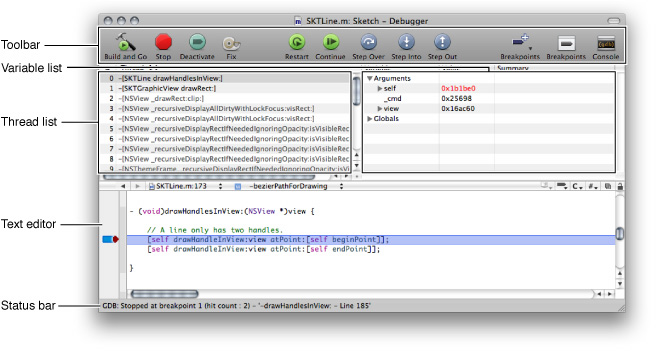
The Debugger window. When you need to perform more focused debugging, the Debugger window provides all the debugging features the text editor provides using a traditional interface. This window provides lists that allow you to see your call stack and the variables in scope at a glance.
The GDB console. A GDB console window is available for text-based debugging.
Important: To debug successfully on a device, you must install on your computer the iPhone SDK corresponding to the iOS release installed on the device. That is, you cannot debug an application on a device running iOS 2.2.1 if you do not have the iPhone 2.2.1 SDK installed on your computer.
For more information about the Xcode debugging facilities, see Xcode Debugging Guide.
Viewing Console Output and Device Logs
The iOS frameworks, such as UIKit, produce log entries to the console to indicate, among other things, when an unexpected event occurs. You can produce console messages in your iOS applications, too. One way to produce console logs is to use the NSLog function. In addition to the Xcode debugger, console logs may help you analyze your application’s logic and track down bugs.
When running your application on iPhone Simulator, you can access its console logs in Console application (located /Applications/Utilities). When you run the application on your development device, log entries from your application appear in the Xcode Organizer.
To view a device’s console output:
Open the Organizer window.
Select the device whose console output you want to view.
Click Console.
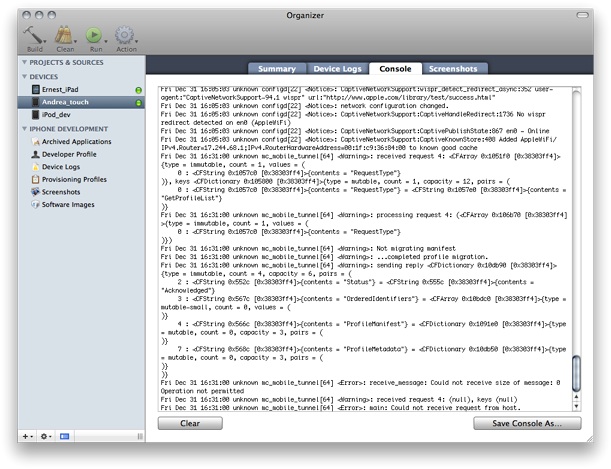
You can save the console output to a file by clicking Save Console As.
The Device Logs pane in the Organizer contains information about application crashes. You may have to unplug your device and plug it in again to refresh the crash list.
For more information about crash logs, see Understanding and Analyzing iPhone OS Application Crash Reports.
Finding Memory Leaks
If you fix a leak and your program starts crashing, your code is probably trying to use an already-freed object or memory buffer. To learn more about memory leaks, see "Finding Memory Leaks".
You can use the NSZombieEnabled facility to find the code that accesses freed objects. When you turn on NSZombieEnabled, your application logs accesses to deallocated memory, as shown here:
2008-10-03 18:10:39.933 HelloWorld[1026:20b] *** -[GSFont ascender]: message sent to deallocated instance 0x126550 |
To activate the NSZombieEnabled facility in your application:
Choose Project > Edit Active Executable to open the executable Info window.
Click Arguments.
Click the add (+) button in the “Variables to be set in the environment” section.
Enter
NSZombieEnabledin the Name column andYESin the Value column.Make sure that the checkmark for the
NSZombieEnabledentry is selected.
For more information about configuring executable environments, see “Configuring Executable Environments” in Xcode Project Management Guide.
iPhone 3.1 SDK introduces the Leaks instrument, which you can use in the Instruments application to easily find memory leaks. For more information, see Instruments User Guide.
Last updated: 2010-07-02