|
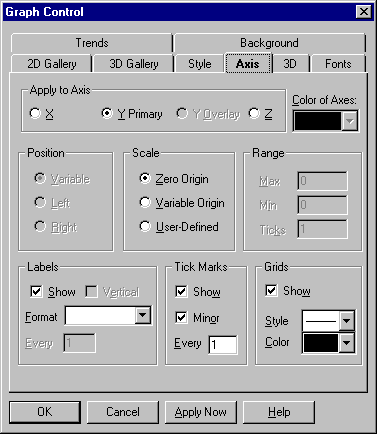
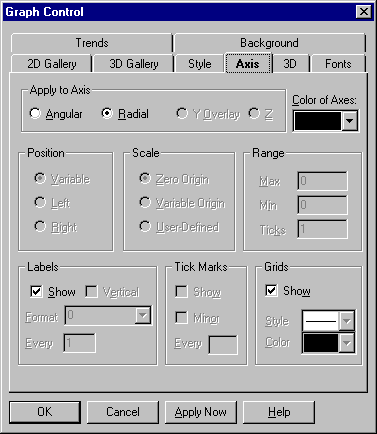
Setting
|
Description |
|
X
|
Select this option to view or change the settings for the X axis. |
|
Y Primary
|
Select this option to view or change the settings for the primary Y axis. |
|
Y Overlay
|
This value is not used by Usage Analyst 2.0. |
|
Z
|
Select this option to view or change the settings for the Z axis. |
|
Color of Axes
(default is black or white)
|
Choose a color for axes from the current color palette. The same color is applied to all axes. The default color is black or white, whichever provides more contrast. |
|
Variable
(default)
|
When X is selected in the Apply to Axis group, select this option to draw the X axis intersecting the Y origin, whether that's at the top, bottom, or middle of the graph.
When Y Primary is selected in the Apply to Axis group, select this option to draw the primary Y axis intersecting the X origin, whether that's at the left, right, or middle of the graph. |
|
Right or Bottom
|
When X is selected in the Apply to Axis group, select this option to draw the X axis at the bottom of the graph, regardless of the location of the Y origin.
When Y Primary is selected in the Apply to Axis group, select this option to draw the primary Y axis at the right edge of the graph, regardless of the location of the X origin. |
|
Zero Origin
(default for all X-Y-Z graphs except time series)
|
Select this option to draw the axis including the origin (zero) and extending far enough in the positive and negative directions to include all of the graph's values. |
|
Variable Origin
|
Select this option to have the axis include just the range of the graph's values, whether or not that range includes zero. For X and Z axes, this option differs from Auto only if you specify X or Z values for data points. |
|
User-Defined
(default for time series graphs)
|
Select this option to set your own values for the minimum, maximum, and number of ticks for the axis. When you select User-Defined, the settings in the Range group are enabled. |
|
Max
(enabled by selecting User-Defined in the Scale group)
|
The Max setting is generally the maximum point of the axis, with the following exceptions:
If you have a positive Max with a negative Min, the Graph Control may adjust the maximum or minimum point so that it lies on a tick. See Ticks.
In 3D graphs, if you specify a Max that's too low to show all your data values, the Graph Control moves the maximum point to show all the values. The Ticks setting still applies.
For X and Z axes without specific X or Z values, the Max setting is ignored. The maximum point of the axis is equal to the number of points or sets you're graphing. |
|
Min
(enabled by selecting User-Defined in the Scale group)
|
The Min setting is generally the minimum point of the axis, with the following exceptions:
If you have a positive Max with a negative Min, the Graph Control may adjust the maximum or minimum point so that it lies on a tick. See Ticks.
In 3D graphs, if you specify a Min that's too high to show all your data values, the Graph Control moves the minimum point to show all the values. The Ticks setting still applies.
For X and Z axes without specific X or Z values, the Min setting is ignored. The minimum point of the axis is always 0. |
|
Ticks
(enabled by selecting User-Defined in the Scale group)
|
The Ticks setting determines the number of ticks along the selected axis. (Note that ticks are different from tick marks--see the Tick Marks group.) The effect depends on the axis and the nature of your data:
For Y axes, X axes with specific X values, and Z axes with specific Z values, the Ticks setting specifies the number of ticks from the origin to the setting of either Max or Min, whichever has the higher magnitude (distance from 0). For example, if you set Min to -50 and Max to 20, Ticks applies to the axis segment between 0 and -50.
To determine the Ticks value you want to set, divide the length of the axis (or axis segment) by the desired interval between ticks. For the axis segment 0 to -50 we've just described (whose length is 50 units), if you want to place ticks 25 units apart, set Ticks to 2.
Both the maximum and minimum points of an axis must fall on a tick. If you have a negative Min with a positive Max, the Graph Control may have to move the minimum or maximum point to make this happen. In our example axis, ticks would be placed at -50, -25, 0, and 25--overriding the Max setting of 20.
For Z axes without specific Z values (3D bar, tape, area, and surface graphs), you can't specify Ticks. The option is disabled. |
|
Show
(default is on)
|
Select this option to show labels along the axis (either text or numeric). Deselect it to remove the labels. The Graph Control allows both text labels and numeric labels. |
|
Vertical
(available for X and Z axes only; default is off)
|
Select this option to display X or Z labels vertically (rotated 90 degrees counterclockwise). Deselect it for horizontal labels. The Vertical option is normally used with text labels. It lets you use a larger font for labels because you don't need as much horizontal space. |
|
Every
(available for X axis only; default is 1)
|
The Every setting determines the frequency with which labels are displayed. A setting of 1 places a label at every tick along the X axis, a setting of 2 places a label at every other tick (beginning with the origin), and so on. |
|
Show
(available for X and Y Primary axes only; default is on)
|
Select this option to draw tick marks along the axis. Deselect it to remove the tick marks. |
|
Minor
(available for X, Y Primary; default is off)
|
Select this option to draw five minor tick marks between standard tick marks. |
|
Every
(available for X axis with zero or variable origin only; default is 1)
|
If you select Zero Origin or Variable Origin in the Scale group, you can use the Every setting to specify the frequency with which tick marks are displayed along the X axis. An Every setting of 1 places a mark at each tick, a setting of 2 places a mark at every other tick, and so on. The X axis must end with a tick mark. If you set an Every value that doesn't include the last value on the axis, the Graph Control will extend the axis so that it ends on a tick mark. |
|
Show
(available for X and Y Primary axes only; default is off)
|
Select this option to draw grid lines perpendicular to the axis, intersecting each tick mark. Deselect it to remove the grid lines. |
|
Line
(default is solid)
|
In this list box, select a style for grid lines. The same style is applied to both X and Y grids. |
|
Color
(default is black or white)
|
In this list box, select a color for grids from the current palette. The same color is applied to both X and Y grids. The default color is black or white, whichever provides more contrast. |