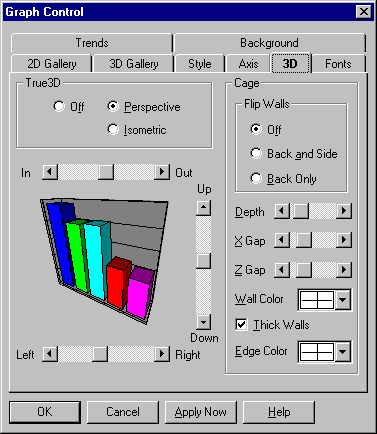
This tab give you a number of property options for 3D graphs.

Property settings for 3D graphs are shown in the following table.
|
Setting |
Description |
|
Select this option for standard 3D. Standard 3D doesn't support such True3D options as rotating cages and Z axis labels. All you can do is set the color of the walls and edges of the graph's cage. |
|
|
Perspective |
Select this option for True3D with perspective projection. You can use the In-Out scroll bar to control the perspective at which graphs are drawn. |
|
Isometric
|
Select this option for True3D with isometric projection. In this mode, angles are rendered as if the graph were viewed from an infinite distance (so all parallels are preserved in the drawing), and the In-Out scroll bar is disabled. |
|
In-Out |
This controls the degree of perspective foreshortening—or the perceived distance from which the graph is viewed—for a True3D graph with perspective projection. The setting determines the acuteness of the angles in the graph. The default In-Out bar setting places the viewing distance at about twice the width of the graph, which is defined as 50 units. Each click in decreases the viewing distance by one unit (to a minimum of 0 units, a distance about equal to the graph's width), and each click out increases the viewing distance by one unit (to a maximum of 100, a distance about four times the graph's width). The In-Out scroll bar is disabled for True3D graphs with isometric projection. In those graphs, angles are drawn as if the viewing distance were infinite, so all parallels are preserved. |
|
Up-Down
|
The Up-Down bar sets the vertical viewing angle for a True3D graph. The default Up-Down bar setting places the viewing angle halfway up the graph, which is defined as 0 degrees. Each click up or down shifts the angle by one degree, to a maximum of 90 degrees (directly above the graph) and a minimum of -60 degrees (somewhat below the floor of the graph cage). |
|
Left-Right
|
The Left-Right bar sets the horizontal viewing angle for a True3D graph. The default Left-Right bar setting places the viewing angle directly facing the front of the graph. Each click to the left or right shifts the angle by one degree, to a maximum of 180 degrees (to the right) and a minimum of -180 (to the left). The values of 180 and -180 provide the same view—directly facing the rear of the graph. |
|
Cage flips |
If you select a viewing angle that would normally cause part of the graph to be obscured, the back or side wall flips to the opposite edge of the cage, letting you see the whole graph. |
|
Off
|
Select this option to disable cage flips. |
|
Back and Side |
Select this option to enable cage flips for both the back wall and side wall. |
|
Back Only |
Select this option to enable cage flips for the back wall only. This option makes it easier for the viewer to stay oriented to the graph, because the side wall always represents the left edge of the cage. |
|
Depth |
This scroll bar lets you vary the projected depth of True3D graphs. The default Depth setting provides equal increments for units in the X and Z directions--a graph with an equal number of points and sets would be of equal width and depth. The numeric value for this default is 100. Each click to the left decreases the value by 5 (to a minimum of 10) and each click to the right increases it by 5 (to a maximum of 1000). |
|
X Gap |
This scroll bar lets you set the gap between the bars of a True3D bar graph. This gap is in the X direction for vertical bar graphs and in the Y direction for horizontal bar graphs. The default X gap setting is 20 percent of the entire possible width of each bar--the remaining 80 percent is occupied by the bar itself. Each click to the left decreases the gap percentage by 1 (to a minimum of 0) and each click to the right increases it by 1 (to a maximum of 95). At the minimum X gap setting of 0, there's no gap between bars. |
|
Z Gap |
This scroll bar lets you set the gap in the Z (depth) direction between data sets in three kinds of True3D graphs with multiple data sets: bar (z-clustered style), area (absolute style), and tape. The default Z gap setting is 20 percent of the entire possible width of each bar (or area plot or tape)--the remaining 80 percent is occupied by the bar itself. Each click to the left decreases the gap percentage by 1 (to a minimum of 0) and each click to the right increases it by 1 (to a maximum of 95). At the minimum Z gap setting of 0, there's no gap between bars. |
|
Wall Color
|
In this list box, select a color for the walls and floor of a True3D graph cage from the current palette. The same color is applied to the back wall, side wall, and floor of the cage. |
|
Thick Walls
|
Select this option if you want the walls and floor of the True3D cage to appear thick with edges. Deselect it for thin walls with no discernible edges. |
|
Edge Color
|
In this list box, select a color for the edges of a True3D graph cage from the current palette. This setting is disabled if you deselect the Thick Walls option. |