The actual calculations made by the Report Writer in producing your reports depend upon a detailed structure of data properties maintained in your database. The standard report composed above made use of them, but they are also available to you directly, so that you can tailor your analyses specifically to your sites and interests. i
You manipulate the details of your analysis by means of a series of filters that operate on data properties. Typical reports might sort all activity on the site which originates from non-academic hosts, for example, or the average number of requests by the second user from each organization versus the average number of requests by the first user from each organization. The following tables summarize all of the data properties which can be filtered and calculated. i
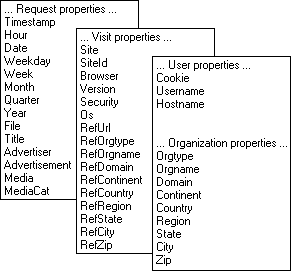
Each request to your Internet sites has the properties shown in the table below.
|
Property name |
Property description |
Example values |
|
Date |
The date of the request. |
October 4, 1958, 8/29/95 |
|
Timestamp |
The time and date of the request. |
10/4/58 1:22 PM |
|
Hour |
The hour of the request. |
0-23 |
|
Weekday |
The day of the week. |
0-6, Sunday, Monday |
|
Week |
The week of the year. |
1-52 |
|
Month |
The month of the year. |
1-12, Jan, January |
|
Quarter |
The quarter of the year. |
1-4 |
|
Year |
The year. |
1995 |
|
Filename
|
The requested file (URI of the URL). |
/index.html, /order*, *.html |
|
Title |
The <TITLE> of the requested file, if media = html, otherwise title is blank. |
"Home page" |
|
Level 1 directory |
The first directory from root ("/") that the request file is in. The root directory is also considered a level 1 directory. |
/a |
|
Level 2 directory |
The second directory from root ("/") that the request file is in. |
/a/b/ |
|
Level 3 directory |
The third directory from root ("/") that the request file is in. |
/a/b/c/ |
|
Level 4 directory |
The fourth directory from root ("/") that the request file is in. |
/a/b/c/d/ |
|
Level 5 directory |
The fifth directory from root ("/") that the request file is in. |
/a/b/c/d/e/ |
|
Level 6 directory |
The sixth directory from root ("/") that the request file is in. |
/a/b/c/d/e/f/ |
|
Media type
|
The media type of the request file. |
html, gif, jpeg, au, wav |
|
Media type category
|
The category of the media type. |
Archive, audio, document, image |
Each visit to your Internet sites has the properties shown in the table below.
|
Property name |
Property description |
Example criteria values |
|
Site title
|
The title of the Internet site as specified in the Server manager of the Import module. |
Usage Analyst marketing web site |
|
Site ID
|
A unique number Usage Analyst assigns to each of your Internet sites. |
1,2,3, etc. |
|
Browser product
|
The browser used to view the site. |
Microsoft Internet Explorer, Netscape Navigator |
|
Browser product version
|
The version of the browser used to view the site. |
1.1, 1.1N, 2.0 |
|
Browser product security
|
The level of encryption security that the browser supports. |
Exportable SSL (40 bit RC4 encryption) |
|
Browser operating system
|
Operating system of the visitor’s computer. |
Windows (32 bit),
|
|
Referring URL
|
The referrer URL of the first request of the visit. |
http://www.yahoo.com/awesome_sites.html |
|
Referring organization type
|
The type of the organization whose site the referring URL is from. See Orgtype. |
See orgtype |
|
Referring organization name
|
The name of the organization whose site the referring URL is from. See Orgname. |
Your Corporation |
|
Referring organization domain
|
The domain of the organization whose site the referring URL is from. See Domain. |
yourcompany.com |
|
Referring organization continent
|
The continent of the organization whose site the referring URL is from. |
See continent |
|
Referring organization country
|
The country of the organization whose site the referring URL is from. |
See country |
|
Referring organization region
|
The region of the organization whose site the referring URL is from. |
See region |
|
Referring organization state
|
The state of the organization whose site the referring URL is from. |
See state |
|
Referring organization city
|
The city of the organization whose site the referring URL is from. |
See city |
|
Referring organization zip code
|
The zip code of the organization whose site the referring URL is from. |
See zip |
Each user of your Internet sites has the properties shown in the table below.
|
Property name |
Property description |
Example criteria values |
|
Cookie |
The persistent client-state HTTP cookie used to identify the user. |
INTERSÉ_!aQFG@4gd |
|
Username |
The user name used by this user to register at the site. |
Bob |
|
Hostname |
The Internet host name address used by this user. |
gateway.interse.com |
Each organization with users of your Internet sites has the properties shown in the table below. In order to obtain this information for your database, you must first perform IP resolution and Whois lookup. (See Chapter 5.)
|
Property name |
Property description |
Example criteria values |
|
Organization type
|
The type of organization as determined by parsing the Internet host name. |
Commercial, academic, non-profit, Internet administrator, government, military, online service |
|
Organization name
|
The name of the organization that registered the domain of the host name. |
Any Corporation |
|
Organization domain
|
The part of the Internet host name that uniquely identifies an organization. |
Anycompany.com |
|
Continent |
The continent where the country of the organization is located. The country is determined by parsing the Internet host name. |
Asia, Europe, Africa, North America, Latin America, South America, Oceania |
|
Country |
The country where the organization is located. The country is determined by parsing the Internet host name. |
USA, France, Germany, Canada |
|
Region |
The geographical region of the United States of the organization that registered the domain of the host name. |
New England, Mid-Atlantic, East North Central, West North Central |
|
State |
The geographical state of the United States of the organization that registered the domain of the host name. |
Full state name or its postal abbreviation (California or CA) |
|
City |
The geographical city of the United States of the organization that registered the domain of the host name. |
Sunnyvale, Palo Alto, New York, Los Angeles, and so on |
|
Zip |
The geographical Zip code of the United States of the organization, or postal code of the Canadian organization that registered the domain of the host name. |
94086, 94087 |
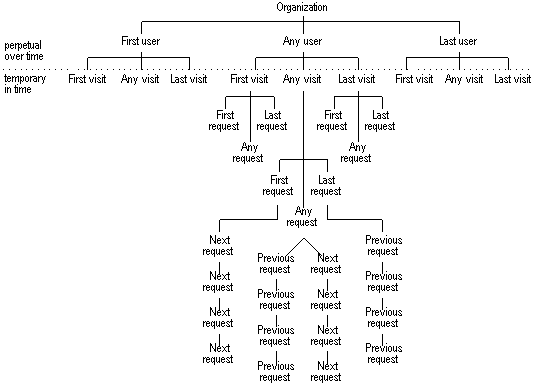
Site Server Express Analysis organizes your data within an object-oriented data structure, so you can conduct complex analyses on trends within your Internet sites. With any request, visit, user, or organization property, you can create a calculation Filter or Group. Understanding this data structure is extremely important to making optimal use of the Report Writer.
As mentioned earlier, the data structure has four distinct objects:
The figure below illustrates the relationship between these objects.
Each request is assigned to a distinct visit; each visit is assigned to a distinct user; and each user is assigned to a distinct organization. Consider the complete picture of the traffic to your site as the world of major league sports. You could say that requests are like a series of games played by a professional athlete. Each game (request) is part of a season or series (visit) and each athlete (user) belongs to a distinct team (organization).
Note that each organization, user, and visit object in the hierarchy has three children: a "first," an "any," and a "last." Specifically,
All visits have three request objects associated with them:
All users have three visits objects associated with them:
All organizations have three user objects associated with them:
Every property has a path from a root object; where root objects are the requests, visits, users, and organizations that can be referred to as part of "any request, by any visit, by any user, from any organization." Properties along this any-any-any-any property path don’t need a prefix when being referenced within a Filter. For example, if you’re just interested in requests during January, then stating Date < 2/1/95 works.
All other properties must be referenced by a path from a root object. For example, if you want to reference the first visits of all of your users, just prefix the visit properties by "User, first visit, property name goes here."
Although it’s possible to refer to a property by its full path in the data hierarchy ("Organization, first user, first visit, first request, date," for example) there are numerous shortcuts, as shown in the table below
iiiiiiiiiiiiiiData property path shortcuts
|
Full path |
Shortcut |
|
Visit, first request |
VFR_ |
|
Visit, first request, next request |
VFRNR_ |
|
Visit, first request, next request, next request |
VFRNRNR_ |
|
Visit, first request, next request, next request, next request |
VFRNRNRNR_ |
|
Visit, first request, next request, next request, next request, next request |
VFRNRNRNRNR_ |
|
Visit, any request |
VAR_ |
|
Visit, any request, previous request |
VARPR_ |
|
Visit, any request, previous request, previous request |
VARPRPR_ |
|
Visit, any request, previous request, previous request, previous request |
VARPRPRPR_ |
|
Visit, any request, previous request, previous request, previous request, previous request |
VARPRPRPRPR_ |
|
Visit, any request, next request |
VARNR_ |
|
Visit, any request, next request, next request |
VARNRNR_ |
|
Visit, any request, next request, next request, next request |
VARNRNRNR_ |
|
Visit, any request, next request, next request, next request, next request |
VARNRNRNRNR_ |
|
Visit, last request |
VLR_ |
|
Visit, last request, previous request |
VLRPR_ |
|
Visit, last request, previous request, previous request |
VLRPRPR_ |
|
Visit, last request, previous request, previous request, previous request |
VLRPRPRPR_ |
|
Visit, last request, previous request, previous request, previous request, previous request |
VLRPRPRPRPR_ |
|
User, first visit, first request |
UFVFR_ |
|
User, first visit, any request |
UFVAR_ |
|
User, first visit, last request |
UFVLR_ |
|
User, any visit, first request |
UAVFR_ |
|
User, any visit, any request |
UAVAR_ |
|
User, any visit, last request |
UAVLR_ |
|
User, last visit, first request |
ULVFR_ |
|
User, last visit, any request |
ULVAR_ |
|
User, last visit, last request |
ULVLR_ |
|
Organization, first user, first visit, first request |
OFUFVFR_ |
|
Organization, first user, first visit, any request |
OFUFVAR_ |
|
Organization, first user, first visit, last request |
OFUFVLR_ |
|
Organization, first user, any visit, first request |
OFUAVFR_ |
|
Organization, first user, any visit, any request |
OFUAVAR_ |
|
Organization, first user, any visit, last request |
OFUAVLR_ |
|
Organization, first user, last visit, first request |
OFULVFR_ |
|
Organization, first user, last visit, any request |
OFULVAR_ |
|
Organization, first user, last visit, last request |
OFULVLR_ |
|
Organization, any user, first visit, first request |
OAUFVFR_ |
|
Organization, any user, first visit, any request |
OAUFVAR_ |
|
Organization, any user, first visit, last request |
OAUFVLR_ |
|
Organization, any user, any visit, first request |
OAUAVFR_ |
|
Organization, any user, any visit, any request |
OAUAVAR_ |
|
Organization, any user, any visit, last request |
OAUAVLR_ |
|
Organization, any user, last visit, first request |
OAULVFR_ |
|
Organization, any user, last visit, any request |
OAULVAR_ |
|
Organization, any user, last visit, last request |
OAULVLR_ |
|
Organization, last user, first visit, first request |
OLUFVFR_ |
|
Organization, last user, first visit, any request |
OLUFVAR_ |
|
Organization, last user, first visit, last request |
OLUFVLR_ |
|
Organization, last user, last visit, first request |
OLULVFR_ |
|
Organization, last user, last visit, any request |
OLULVAR_ |
|
Organization, last user, last visit, last request |
OLULVLR_ |
Only requests have a specific date and time associated with them. When you want to restrict a calculation to visits, users, or organizations active during a specific time period, you must use a specific request object, with a complete path from the visit, user, or organization object you’re analyzing; for example, "UFVAR_Date < 2/1/95", filters out all users except those whose first visit was before February 1, 1995.
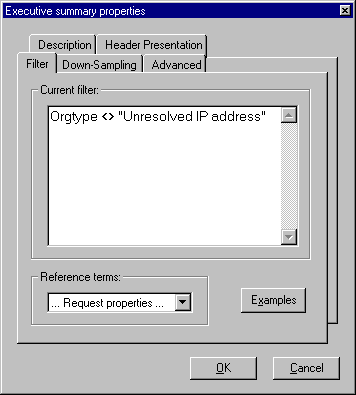
The Report Writer provides for filtering of data at the section level, the calculation level, and the measure level of the analysis hierarchy. This allows you to look at highly specific subsets of data. For example:
To provide the maximum flexibility, specify criteria using Boolean expressions of name/value pairs:
<name><operator><value> [<conjunction> <name><operator><value>][…] i
Criteria names are based on the properties of requests, visits, users, and organizations. Every property listed in the tables at the beginning of the Analysis module section can be used within a filter expression. Unless otherwise specified, the criteria name is the property name. For example,
Different criteria values are appropriate for different properties. In general, a criteria value is either a date, an integer, a string, or a relative criteria expression. The property charts within the previous section provide example values for each property name. In general, values follow these rules:
Relative criteria expressions are useful if you want to create reusable files. For criteria names and expressions, see the following table.
|
Criteria name |
Relative criteria values |
|
Year |
ThisYear, LastYear |
|
Quarter |
ThisQuarter, LastQuarter |
|
Month |
ThisMonth, LastMonth |
|
Week |
ThisWeek, LastWeek |
|
Day |
Today, Yesterday |
For example, if you want to run a report every week that analyzes data for just the current week’s traffic, rather than constantly editing a filter to include traffic between the date seven days ago and today’s date, you can simply add the criterion:
Week = ThisWeek
Any of the relative values can have "[-+]#" appended to indicated a time period previous to the relative time period, measured in increments of that time period. For example, "ThisWeek-1" is the same as "LastWeek", "ThisWeek-2" is the week before last week, "Today-3" is the day before the day before yesterday, and "Month-2" is two months ago.
Criteria values may include wildcard characters as shown in the table below.
|
Character |
Usage |
Example |
|
* |
Matches any number of characters. It can be used as the first or last character in the character string. |
d* matches Debra and David |
|
? |
Matches any single alphabetic character. |
jo?n matches John and Joan |
|
[] |
Matches any single character within the brackets. |
[jt]erry matches Jerry and Terry, but not Kerry |
|
! |
Matches any character not in the brackets. |
[!jt]erry matches Kerry, but not Jerry or Terry |
|
- |
Matches any one of a range of characters. You must specify the range in ascending order (A to Z, not Z to A). |
[c-e]d matches cd, dd, and Ed |
Note
When searching for *, ?, [, or - you must enclose the item you’re searching for in brackets (cgi[-]bin matches cgi-bin, for example.)
i
Criteria operators define the relationship between the name and value. Valid operators are:
|
= |
when name equals value, i.e., Country=USA |
|
<> |
when name does not equal value, i.e., Country<>USA |
|
< |
when name is less than value, i.e., Hour < 12 |
|
> |
when name is greater than value, i.e., Hour > 12 |
|
>= |
when name is greater than, or equal to, value, i.e., Hour >=12 |
|
<= |
when name is less than, or equal to, value, i.e., Hour<=12 |
Using criteria conjunctions and parenthesis, multiple name/value pairs may be strung together to create more complex criteria. Valid conjunctions are:
|
and |
when both expressions must be true for the criteria to be true |
|
or |
when either expression can be true for the criteria to be true |
For examples of filters, see the table below.
|
Filter goal |
Filter criteria |
|
Only include files from the product directory |
file = /product/* |
|
Exclude files from the product directory |
file <> /product/* |
|
Include only the products, but not widget A |
(file = /product/*) and (file<> product/widgetA*) |
|
Only analyze requests for HTML files |
media = HTML |
|
Only analyze visits using an IE browser |
product = Internet Explorer* |
|
Analyze all traffic on December 25, 1995 |
Date = 12/25/95 |
|
Analyze all traffic from cities that start with San in the state of New Mexico |
city = san* and state = NM |
|
Analyze traffic for the previous month |
month = LastMonth |
The top level of the hierarchy in the analysis tree is the Section, represented by the funnel icon. A section may contain sub-sections as well as calculations. They may also contain a filter expression which is applied to all sections and calculations within that section. i
Sections can be filtered on all of the database properties. i
Down-sampling works by performing analysis operations on a reduced portion of the data from your database. Depending on the factor you select, the analysis module will examine only those visits beginning in the first fraction of an hour. The integrity of the information is preserved by looking at entire visits (as opposed to imposing an arbitrary time cut-off, which would produce large numbers of open visits). In order to compensate for the artificially low numbers generated, the analysis module then multiplies all down-sampled results by the reciprocal of the down-sample factor. This effectively says, "Let the visits beginning in the first 1/x of each hour be considered typical, and multiply the resulting request-data by x, to approximate additional visits beginning in the remainder of the hour."
Note
Down-sampling is an operation performed during analysis only, and doesn’t otherwise affect the information stored in your database.
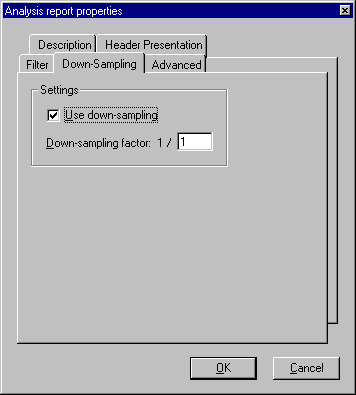
The Report Writer supports down-sampling of your data, which reduces effective data-size to as little as 1/3600th of the original. This can greatly speed the process of analyzing your data. The down-sampling tab allows you to specify the down-sampling factor for an analysis.
Down-sampling accepts integers from 1 to 3600, with the following results:
Your data is not affected by down-sampling. Results are unmodified.
All visits that begin within the first (factor x 60) minutes of the hour are analyzed, and all results are multiplied by (1/factor) to compensate.
All visits that begin within the first (factor x 3600 ) seconds of the hour are analyzed, and all results are multiplied by (1/factor) to compensate.
Down-sampling reduces your computational time in direct proportion to the down-sampling factor. However, keep in mind the results of down-sampled calculations are approximations. i
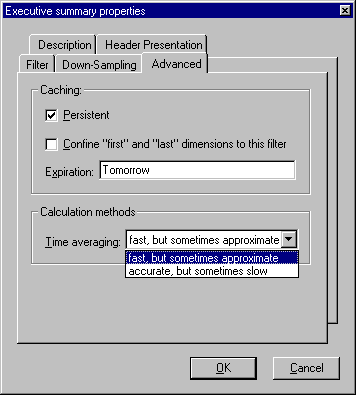
The filter expression within a section can be treated in several different ways, represented by the advanced tab of the section form.
When the Persistent caching option is checked, the Report Writer creates a set of temporary tables in the database containing the results of the filter entered in the Filter tab. These tables are then used for any calculations that need the filter. This process can greatly speed up reports than contain many calculations using the same filter, especially if the filter eliminates a large portion of the overall data set. For example, if your report is meant to display data for last week, and there is a year’s worth of data in your database, using a persistently cached filter of "week = lastweek" in the root section will greatly speed up the report. The temporary tables will continue to exist in your database and will be referenced by any future reports with compatible filters. These tables will be removed once the date defined in the expiration box is reached, or if new data is imported which invalidates them.
The Confine ‘first’ and ‘last’ dimensions to this filter checkbox allows you to define how this filter will treat first and last dimensions. If this box is checked, then any first and last dimensions will be limited to the data in the temporary tables. If not checked, the first and last dimensions are absolute over the entire data set within the database. For example, if the box is checked, a "User First Visit" property on a "week = lastweek" filter will refer to the user’s first visit that took place last week. However, if you wanted to count the number of new users visiting your site last week, you would want to count the number of "User First Visits" without the checkbox checked. That way, a user’s first visit would only be counted if it was the first visit for that user over the entire period contained in your database. i
The time averaging option is by default set to Fast, but Sometimes Approximate. Consider using Accurate, but Sometimes Slow, if the section contains a measure or dimension that is averaged over a time period (average requests per hour, for example). As a rule of thumb, the fast time averaging should be used unless the filter removes chunks of time within the endpoints of the filter time period. For example, a filter that removes weekends or non-work hours should probably use the accurate time averaging. i
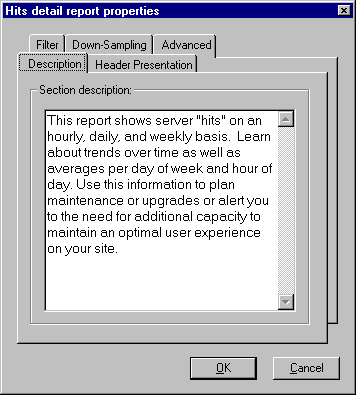
The description tab allows you to create a text description that will be contained in the report just under the section header. Use this option to create clear and readable reports.
Note
You must select the option to display the description on the Header presentation tab (by default section descriptions are not displayed).
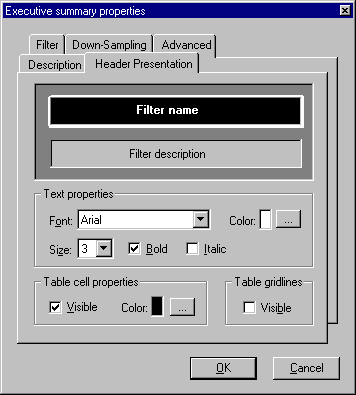
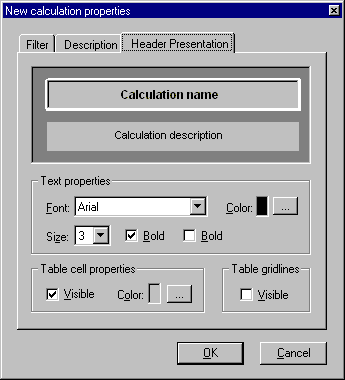
The Header Presentation tab allows you to customize the look and feel of the section header and description report elements. The Filter name bar in the upper window is selected by default. To change your selection, simply click anywhere on the filter description bar.
Each element has several customization options: text properties, table cell properties, and table gridlines. In the text properties box, you can control various font elements, including style, size, and color. In the table cell properties, you determine if you want to display the filter name or description and the color of the display banner. Clicking the Visible box in the table gridlines box causes gridlines to be displayed. Click OK after you have made your selections or changes in this tab.
The calculation is the basic building block of the reports. One calculation represents a single slice of the data contained in the database. Each calculation can be viewed as a table or a graph. Calculations are made up of row dimensions, column dimensions, measures, and presentations.ii i
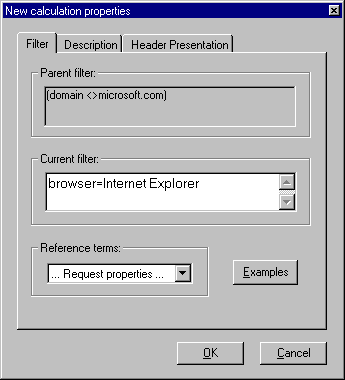
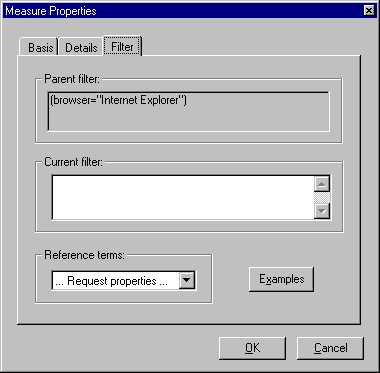
A calculation can have its own filter expression applied to it, in addition to any filters contained in its parent sections.
The parent filter section of the filter tab displays the combined filters of all the sections above this calculation. Under this is the current filter box, in which the filter expression for this calculation can be entered.
Note
The advanced options available for section filters are not available for calculation filters.
To add a calculation filter, you have two options. You can type the filter expression into the window of the current filter box. Or, you can drag and drop filter terms and operators from the Reference terms section found at the bottom of the filter tab. Open the drop down list in that section to display the available filter terms. Select the one you want by clicking it, then dragging it into the current filter window. You will also find the supported Boolean operators (and, or, >, etc.) at the bottom of this list. Finally, you’ll need to type in the filter argument (ThisWeek, 2/25/97, for example).
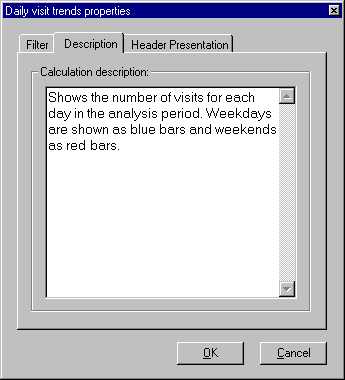
As in the Section property box, you can add a description that clearly explains the components of the calculation, its filters, what the results should be, and how they should be reviewed.
As in the Section property box, you can edit the calculation name and description style and appearance. i
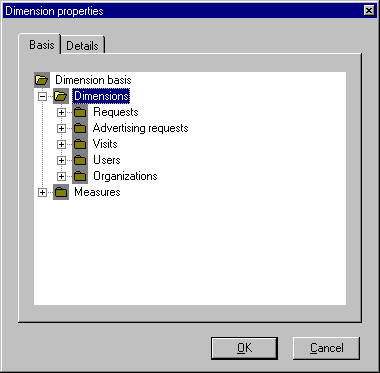
Dimensions are the properties that are used to divide up the data into an understandable table or graph format. Both row and column dimensions can be defined. The data that is output for each calculation will be based on the row and column dimensions defined for that calculation. For example, a calculation with a row dimension of country and a column dimension of week will create a table with the various countries along the side, and the various weeks along the top. The intersecting cells will contain the data for each country during each week.
Note
Including a row or column dimension is not required to define a calculation.ii
i
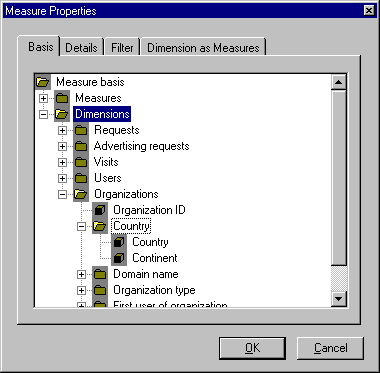
All of the Analysis Report properties can be used as dimensions. (See "Analysis report properties.") All of these properties can be found in the Basis tab’s tree divided up by category (requests, advertising requests, visits, users, and organizations). Any of the Measure properties can also be used as dimensions.
To select a dimension, simply navigate through the tree structure, then select the dimension you want by double clicking it or single clicking then clicking OK. Repeat this process to add additional dimensions.
Each dimension also has several options associated with it that influence how the calculation will be displayed.
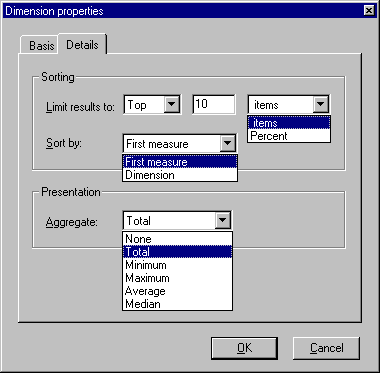
The sorting options control how many items of this dimension are displayed, and what order they are displayed in. The results can be limited to a certain number (items) or a certain percent of the total (percent). These can be either the top or bottom amount of items based either on the value for the items themselves, or the total value of the first measure for each of the items.
The aggregate option lets you define whether or not you want the measures for this dimension aggregated for all items displayed. The total, minimum, maximum, average, or median for all items of this dimension can be displayed as the final element of the list. This characteristic only applies to tables.
Note
Aggregates only apply to certain measures.
i
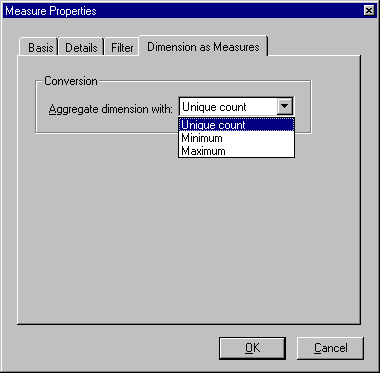
Properties that formerly could only be treated as measures can now be used as dimensions. If you choose one of these measure properties in the tree on the Basis tab, a Measures as Dimensions tab appears with some options that are specific to this case.
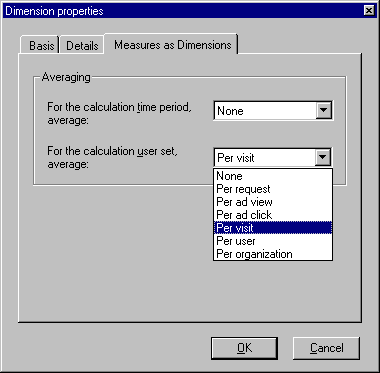
Time-Averaging Option Box
In order to treat a measure as a dimension, the measure must be averaged over a user set. The user set averaging must also be based on a measure, and this averaging measure must be equal or higher on the object hierarchy. For example, a measure of number of visits can be averaged per user or per organization. If you chose number of visits per user as your dimension, the dimension items would be 1,2,3…, referring to the users who have one visit, two visits, or three visits. If your actual measure was the number of users, then your table or graph would contain each discreet number of visits in the dimension value and the number of users who had that many visits in the corresponding measure value.
A measure treated as a dimension can also be averaged over a time period. In this case, the discreet values for the dimension are rounded to the nearest whole number.
Note
When you choose to have a measure as a dimension, any other dimensions in the calculation should be properties that are equal to or higher in the object hierarchy than the property used for user set averaging. Choosing dimensions lower on the hierarchy can lead to unpredictable results.
i
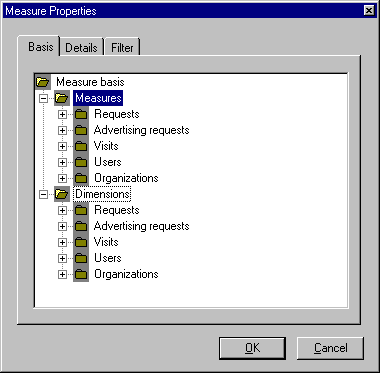
Measures are the properties that are actually counted in the calculation, such as the number of visits or the total duration of all requests. A calculation must contain at least one measure. Different measures can have their own filters applied to them in addition to any filters applied to the calculation. All of the measure properties can be found in the tree under the Basis tab grouped by the root objects that they apply to.
The Details tab reveals certain options that allow you to format exactly how the measure will be calculated and displayed.
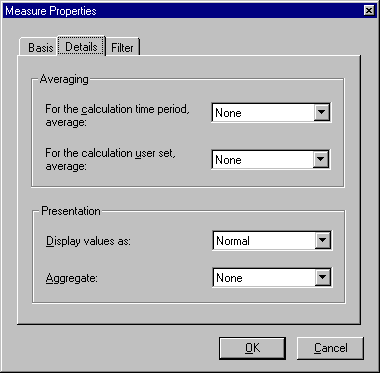
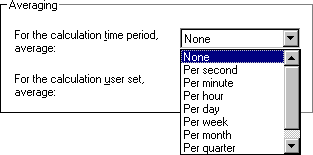
A measure can be averaged over a time period and/or a user set. The time period averaging will take the measure and divide it by the number of the time periods that are being analyzed. Normalization also takes place, so if your data includes two weeks in August it will be averaged as though the entire month was included. User set averaging involves dividing the measure by some other measure property that is equal or higher on the object hierarchy. For example, you could have visit duration averaged per visit, per user, or per organization.
The Presentation options affect how the value for that measure will be displayed. A measure can be displayed normally; as a running total in row or column; or as a percent of row, column, calculation total, or total. At the end of the table, you can also choose to have an aggregate for the measure. This can be the average, the minimum, the maximum, the median, or the total. i
The Filter tab enables you to apply a filter specifically to one measure in a calculation. This tab is the same as the one for a calculation, with a window containing the aggregate of all parent filters that will be applied to this measure, and a box for this measure’s specific filter. Any filter that could be used at the section or calculation level can be applied to a measure. This option can be useful if, for example, you wish to have a measure that is the number of requests last week alongside another measure with the number of requests all month.
Just as any measure property can be used as a dimension, any dimension property can be used as a measure.
Dimension properties can be used as measures in any one of three ways:
Note
Unlike measures as dimensions, the minimum and maximum options actually require another measure to be part of the calculation.
If you set a request property as a row dimension and then specify a filter criterion that includes a visit property, then you’re counting all requests from visits that met that filter. For example, if requests is the measure, file name is the row dimension, and the filter is Browser=Microsoft*, you get the number of requests made by a Microsoft browser for each file.
However, if a visit property is your row dimension and you then specify a filter criterion that includes a request property, then you’re only counting visits which include a file meeting that filter criterion. For example, if you count requests with referring URL as a row dimension and File=/order.html as a filter, you calculate the top referring URL that delivered people to your order page. Of course, counting the number of requests might not be optimal, since the order page might be requested twice in the same visit. So the best way to create this calculation is to set number of visits as the measure.
The relationship of dimension to filter is consistent when looking up or down the object hierarchy. For example, looking down the object hierarchy:
Looking up the object hierarchy:
For your reference, several example questions are listed below, along with the corresponding measures and dimensions requiremed to answer the question. The standard analysis files included with Site Server Express Analysis are another excellent reference to calculation property combinations. Just open these files, double-click the individual calculation properties, and view settings that achieve the calculations found within the standard reports.
|
Measure: |
# of requests |
|
Dimension: |
Request, document title |
|
Measure: |
# of visits |
|
Dimension: |
Request, document title |
|
Measure: |
# of visits |
|
Dimension: |
Request, level 1 directory |
|
Measure: |
# of requests |
|
Dimension: |
Request, level 2 directory |
|
Request, level 3 directory |
|
|
Request, level 4 directory |
|
|
Filter: |
File = /entertainment* |
|
Measure: |
# of requests |
|
Dimension: |
User, user name |
|
Request, level 2 directory |
|
|
Request, level 3 directory |
|
|
Request, level 4 directory |
|
|
Filter: |
File = /entertainment* and Username <> Unregistered* |
|
Measure: |
# of requests |
|
Dimension: |
Organization, name |
|
Request, level 2 directory |
|
|
Request, level 3 directory |
|
|
Request, level 4 directory |
|
|
Filter: |
File = /entertainment* and Username = Unregistered* |
|
Measure: |
# of requests (with User averaging: per visit) |
|
Dimension: |
Visit, browser product |
|
Request, level 1 directory |
|
Visit duration (with User averaging: per visit) |
|
Measure: |
# of requests (with User averaging: per visit) |
|
Filter: |
VAR_filename = /order.html |
|
Measure: |
# of visits |
|
Dimension: |
Visit, first request, file name |
|
Visit, first request, next request, file name |
|
|
Visit, first request, next request, next request, file name |
|
Measure: |
# of visits |
|
Dimension: |
Visit, any request, file name |
|
Visit, any request, previous request, file name |
|
|
Visit, any request, previous request, file name |
|
|
Filter: |
VAR_filename = /order.html |
|
Measure: |
# of requests (with User averaging: per visit) |
|
Filter: |
filename = /order.html |
|
Measure: |
Visit duration (with User averaging: per visit) |
|
Dimension: |
Organization, type |
|
Filter: |
File=/documentation* |
|
Measure: |
Request duration |
|
Dimension: |
User, user name |
|
Filter: |
File=/documentation* |
|
Measure: |
# of requests |
|
Filter: |
Media=Java and Browser<>Netscape* |
|
Measure: |
# of users |
|
Filter: |
Security=*SSL* |
|
Measure: |
# of users |
|
Filter: |
City=Swampscott and State=MA and Browser=Microsoft* and Referrer=InfoSeek* and File=/menu.html and File=/confirm_order/lasagna.html |
|
Measure: |
# of requests |
|
Dimension: |
Request, document title |
|
Filter: |
UFV_RefOrg=InfoSeek* and UFVAR_Date < 2/1/95 |
|
Measure: |
# of visits |
|
Dimension: |
Visit, Referring URL |
|
Filter: |
File=/order.html |
|
Measure: |
# of requests |
|
Dimension: |
User, first visit, any request, document title |
|
Filter: |
Organization="Intersé Corporation" |
|
Measure: |
# of requests |
|
Dimension: |
Organization, first user, last visit, any request, document title |
|
Filter: |
Organization="Intersé Corporation" |
|
Measure: |
# of visits |
|
Dimension: |
Visit, first request, month |
|
Filter: |
Country=Korea |
|
Measure: |
# of requests |
|
Dimension: |
Request, day |
|
Filter: |
Date > Today-11 And File=X |
|
Sort: |
by dimension |
Presentations establish the output of your reports. They take the form either of a graph or a table, each with an appropriate icon. They are set in the hierarchy at the level of the calculation, so that you can customize the look and format of your reports for each actual analysis you make. You are also free to add multiple graphs or tables to a calculation, which gives you enormous flexibility in representing your results.
The two types of presentation, tables and graphs, can both be modified for content (the elements they display) and for design (their color, look, and form). Settings for individual tables or graphs are made whenever a presentation is added to an analysis, or the settings can be edited by right-clicking a table or graph icon and selecting Edit.
Note
General settings that apply to all graphs and tables are selected through Options on the Tools menu.
i
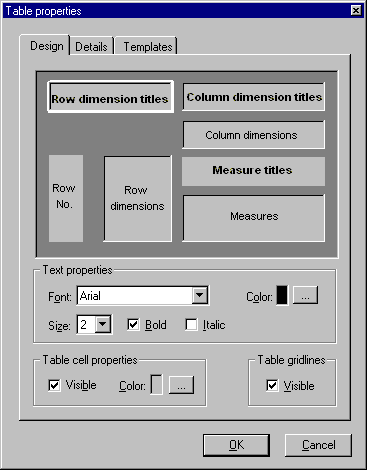
The figure above shows the Details tab of the Table properties sheet. Using this tab, you can customize the design of your table by selecting fonts, colors, layout, and so on.
The upper half of the tab lists all table elements in their standard diagrammatic format. The lower half provides a way to alter text properties, table cell properties, and table gridlines. To edit the text properties for a particular table element, select the table element in the upper half of the tab by single clicking the box containing the label for that element. Then, proceed to change one or more of the following font-related options: type (Arial, Times Roman, and so on.), size of font, style of font (bold, italic), or color of font.
You may also choose whether or not to display the table element in the table. In the table cell properties box, if you check Visible, the table element that is selected in the upper half of the tab will be displayed. The color option selects the background color for the table element.
Finally, the Table Gridlines box contains an option that affects the entire table layout. If Visible is checked, the table will be displayed with gridlines. Otherwise, the table will display table element labels and measure values without separating lines.
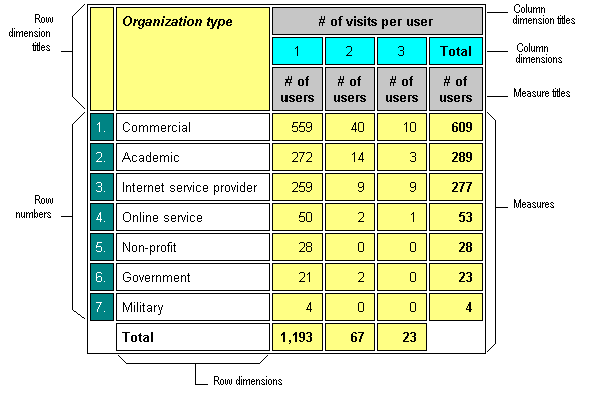
The figure below represents more precisely the layout of the elements in a typical table found in any of the standard reports.
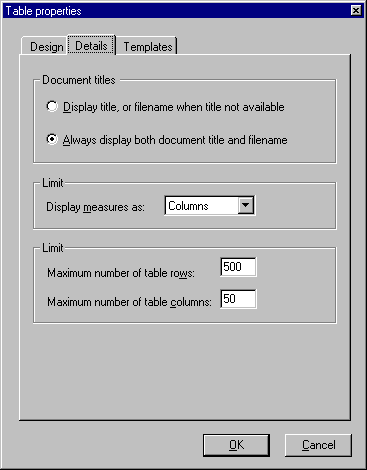
The Details tab contains several options that impact the contents and layout of your table. The top box on this tab, Document titles, is only relevant to tables that contain "Title" as a row or column dimension. Within this box, selecting the top option indicates that you want to view document titles in your table. Document titles are found by running the HTML title lookup utility from Usage Import. If the document title is not available, then the file name will be displayed. The second option is to display both title (again, if available) and file name.
The middle box allows you to set the way measures are displayed in the table. Measure labels and values can either be shown in rows or columns. The default value is to show them in columns.
The last box on this tab controls the size of the outputted table. By default, a table can have no more than 500 rows and 50 columns. i