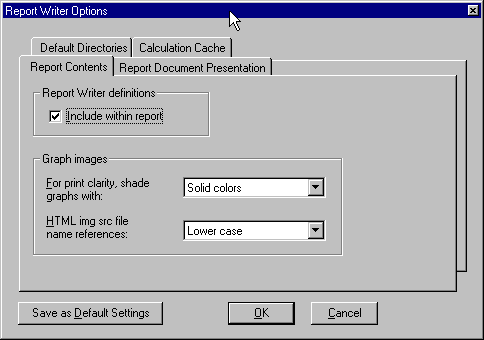
The Options selection from the Tools menu allows you to set preferences for a number of general Report Writer operations.
The top section of the figure above concerns the inclusion of usage analysis definitions at the bottom of every generated report.
The Graph Images box contains options related to the output format and file naming for images generated in Report Writer's reports. You have the option of printing graphs with solid colors or patterned lines. If you plan to print reports, you should select printing with patterned lines. In the HTML img src box, select the case to use in naming image and source files. If you are moving images onto a UNIX computer, be sure to select the correct case sensitivity option.
The Report Presentation tab provides two general options related to report style that will be applied to all generated reports. The first option is the display of the header information. The header contains information about the analysis time period, site analyzed, and report sections. The default is to display this information. You have the further option of altering the font type, size, and color. The bottom box on this tab controls the background color for the report.
The Default Directories tab allows you to set the path information for completed reports, analysis files, and template files.
The Calculation Cache tab allows you to speed up report generation by re-using previous calculation results. The cache folder shown in the directory in the middle of this tab contains files which store the results of recent calculations.
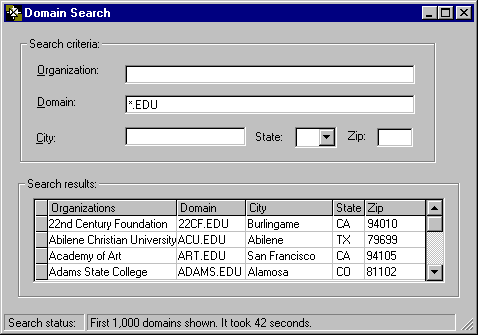
The Domain search window allows you to examine your database for queries which match any of the domain information maintained by Microsoft Site Server Express. This provides a rapid first check to aid in developing analysis filters. For example, you can query the database for visits from a particular city, state, zip, or organization, or you can use wildcards as criteria for searches on the domain names themselves. When your domain search produces significant results, you may want use them to devise a complete analysis report.
The figure below shows a domain search that details requests originating from educational institutions (*.edu).

The organization, domain and city fields in domain searches accept the standard wildcards; for state and zip code, you must submit complete entries of the appropriate length and syntax (i.e. the two letter state postal codes, and the five-digit zip codes, respectively). Once you specify the criteria you’re interested in, click the green Start button on the toolbar or the Enter key. The Search results grid displays a maximum of 1,000 domains that match your criteria. The results can be sorted in the manner of the database contents window, by double-clicking the column you wish to use as the sort key.
The Save options on the File menu of the Report Writer allow you to preserve your Filters and Calculations. Since analyses provide the data out of which the reports are created, they are saved as discrete files with a unique *.mfa file name and extension. Mfa files may be saved anywhere on your computer, but if you place them in the Catalog folder and its subdirectories, your analyses will be available whenever you open the Catalog from the Report Writer's File menu or by means of the Open Analysis Catalog button on the toolbar. (The reports generated are saved with the appropriate *.htm, *.doc, *.xls, and *.txt extensions, for HTML, Word, Excel, and text documents, respectively.)
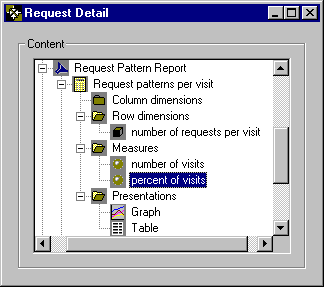
The tree displays the name of each element or node. The analysis reports use these names to label results. If you want to rename a node, simply click its name to highlight and again to bring up the edit box with the flashing insert-cursor.

Note
No two nodes at the same level can have the same name (two sections in one report, or two calculations in one section, for example). Node names are case insensitive.
If you’re not interested in the results of a specific section or calculation, or if a calculation simply takes too long to complete, you may want to delete a node. To do this, simply click the node, and click Delete. The program prompts you to confirm the delete. You can also use the delete key on the toolbar.
Note
Once you confirm that you want to delete the node, you cannot recover that node unless you previously saved an analysis file.
To change the order in which a section appears in the report, or in which the results of a calculation appear within a section, you can move the node. Simply highlight the node, and then drag and drop it to the desired location. You also have the option of using the up and down arrow icons on the toolbar.