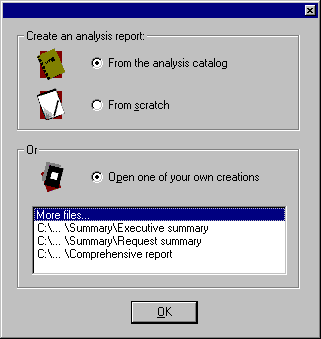
When you start the Report Writer, you are presented with a sequence of windows that facilitate the creation of your reports. The first window gives you the option of choosing an analysis from a catalog of standard reports, creating your own from scratch, or selecting one you have previously created.

The file window displays the last four analysis reports used. You can access others by double-clicking More files and browsing your file hierarchy. Initially you’ll want to choose one of the standard reports; as you gain proficiency with the Report Writer, you’ll be able to devise your own quite rapidly.
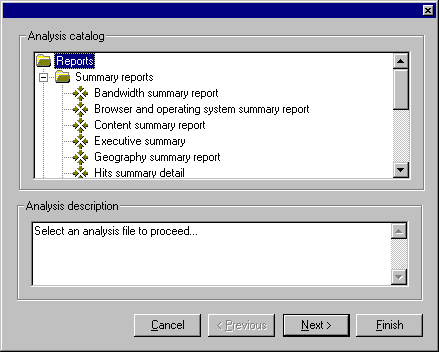
The Report Writer Catalog contains more than 25 standard reports. They are organized in a tree hierarchy, according to the contents of the Catalog subdirectory of the folder where the Report Writer is installed. Once you’ve created analysis reports of your own, if you save them to the Catalog subdirectory, they’ll also be available from the catalog window. The standard reports are grouped as Summary reports, Detail reports and Audit reports.
Highlight a report to view a brief description of its characteristics, as summarized in the table below.
|
Analysis file |
Description |
|
Executive summary |
This report shows top level information to give you an at-a-glance look at the activity on your web site. For detailed information on a particular section of this report, refer to the corresponding detail report. This report requires that IP resolution, Title lookups, and Whois queries be completed before analysis. |
|
Bandwidth report |
This report shows byte transfers on an hourly, daily, and weekly basis. It identifies trends over time as well as averages per day of week and hour of day. Use this information to plan maintenance or upgrades, or alert you to the need for additional capacity. |
|
Browser and operating system report |
This report shows browser market share, trends in Microsoft and Netscape versions and security support, and user operating systems. Use this information to design your site for proper user experience. This report requires user agent data within your server log files. |
|
Content report |
This report shows the number and distribution of media type categories (documents, applications, and scripts) and media types (HTML, pdf, and CGI scripts) throughout the directory structure of your web site. Use this information to manage the content on your sites. |
|
Geography report |
This report shows the top cities, states/provinces, and regions in the U.S. and Canada as well as the international countries visiting your site. Use this information to target your efforts towards the origin of your visitors, and to determine where to mirror your sites. This report requires that IP resolution and Whois queries be completed before analysis. |
|
Hits report |
This report shows server hits on an hourly, daily, and weekly basis. Learn about trends over time as well as averages per day of week and hour of day. Use this information to plan maintenance or upgrades, or alert you to the need for additional capacity. |
|
Organization report |
This report shows the U.S., Canadian, and international organizations that visit your web site. Use this information to monitor your target audience, identify new target customers, and generate leads from frequently visiting organizations. This report requires that IP resolution and Whois queries be completed before analysis. |
|
Path report |
This report shows the sequence of requests that users make when visiting your site. Use this information to assure proper location of key content and to optimize the navigation within your site. This report requires that Title lookups be completed before analysis. |
|
Referrer report |
This report shows the top external organization names and URLs that users linked from to reach your site. Use this information to evaluate the effectiveness of online advertising or promotions, or to identify synergistic locations for such programs. This report requires referrer data within your server log files, and IP resolution must be completed before analysis. |
|
Request report |
This report shows the most and least requested documents over time and by directory. Learn which elements in your site attract the most attention from users. This report requires that Title lookups be completed before analysis. |
|
User report |
This report shows trends in first time and total user visits, user visit frequency, and in unregistered and registered users. Frequent user visits signal that you have created a compelling site. This report requires registration on your site or cookie data within your server log files. |
|
Visits detail report |
This report shows when your users visit, on an hourly, daily, and weekly basis. Learn about trends over time as well as averages by day of the week and hour of the day. Use this information to understand the behavior of your customers. |
|
Comprehensive analysis |
This report shows detailed information to give you an in-depth look at the activity on your web site. This report requires that IP resolution, Title lookups, and Whois queries be completed before analysis. It includes, organization, geography, request, visit, referrer, browser and bandwidth summaries, as well as an overview. |
|
Audit report (I/Pro format) |
The format and content of this report reflects that of an I/Pro I/Audit report. It only contains request information on HTML pages. If your site generates HTML pages from scripts or similar means, you should amend the root filter expression to capture this page activity. You should also perform IP resolution from the Import module for best results. |
|
Audit report (ABVS compliant) |
This report is compliant with ABVS web site activity reporting standards. It only contains request information on HTML pages (that is, the root filter contains the expression media=html). Requests for HTML pages are defined as Page impressions. You should perform IP resolution from Usage Import for best results. |
|
Audit report (BPA compliant) |
This report is compliant with BPA web site activity reporting standards. It only contains request information on HTML pages (that is, the rootfilter contains the expression media=html). Requests for HTML pages are defined as page requests. You should perform IP resolution from Usage Import for best results. |
To choose a particular report, highlight it and double-click, or highlight and click Next on the Analysis catalog window.
Note
For the present purposes of introduction, you only need to select an analysis report. The three screens thereafter can be left without selections.
If you have configured multiple Internet sites, the next window determines which sites are to be analyzed. If you’ve configured only one Internet site, then you won’t see this window. The selection box will list all sites for the current database configured in the Server manager of Usage Import (default is all of your Internet sites).
Selecting an aggregate of all your Internet sites treats all data you’ve imported as if it came from one site. Within the selection box at the bottom of the window, you can select any combination of your Internet sites. All data from sites you select are "aggregated" together and treated as one data set.
The window that follows allows you to specify a date range for your analysis (default is every request).
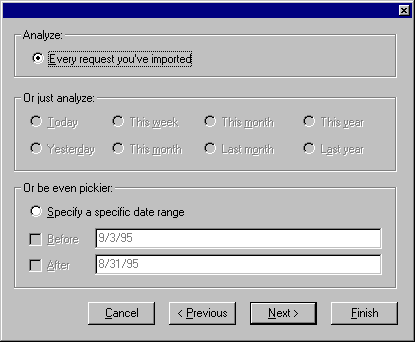
If you haven’t imported any log files for the time periods specified in the middle of this window, those options will be grayed out.
The final window of the opening sequence prompts you to enter a filter to delimit the data you want to analyze. You can filter your analysis using any of the database properties. (See "Analysis report properties" in Chapter 5.) If you specified sites or dates in the previous windows, they will appear as Boolean filter expressions here.
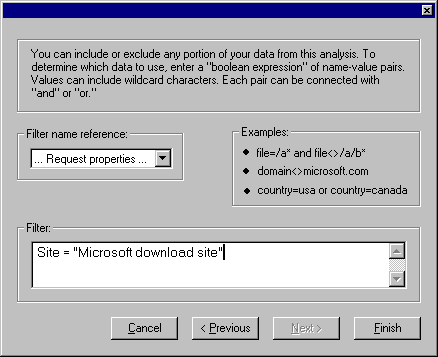
When you have completed the filter window, click Finish to bring up the analysis you chose from the Report Writer catalog.
Note
Clicking Finish at any point before the end of the sequence of four windows will bring up the analysis you have selected with the settings you have specified to this point, and with default settings for any windows which you have skipped or left unchanged.
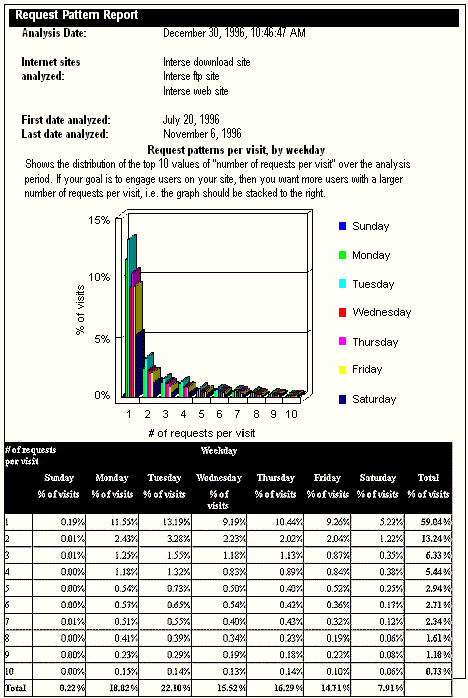
Once you have completed the sequence of windows for a catalog analysis, you will arrive at the analysis content window (see figure below). The analysis used here as an illustration is the Request Pattern Report.
In the Report Content window, the various features of the analysis are represented by a graphical tree, which you navigate by clicking branches and folders to open or close sub-elements. At the highest level is a filter corresponding to the specific analysis report (represented by a blue filter-cone icon); beneath that are individual calculations (a calculator icon) and their component dimensions (a cube icon), measures (a sphere), and presentations (either a graph or a table). For more elaborate reports, there can be a number of sub-filters, which correspond to subsections of the analysis report. At this point, all of the various report properties, including those set in the four analysis setup windows, can be edited by right-clicking the individual icons. Details of the report elements and their properties are discussed below.i
To create a report, you don’t need to do any editing; just click the green Start button in the toolbar, which will bring up the document managing window. Use this window to select the type of report file you want and decide where you want to save it.
The file formats supported for reports are HTML, MS Word, MS Excel, and fixed-width text ready for email distribution.
Note
If you do not have Word or Excel installed, you won’t be able to save reports in those formats, since Report Writer depends on having the applications running in order to create the actual report.
i
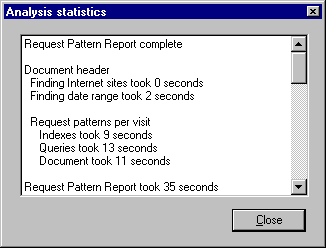
Statistics for the completed analysis are displayed in the Analysis Statistics window. These statistics are valuable in determining how individual calculations work and how long they take.
If certain calculations take too long, consider using a down-sampling factor (see "Filters: Down sampling" in Chapter 6) to reduce complexity, or deleting them from future analyses.
Note
Report Writer uses query results caching between calculations; therefore, the number of queries required to complete a calculation may vary for a single report.
The completed report will be opened and displayed by the appropriate program for the type of file you selected. All of the reports can be edited and saved in the usual way once the Report Writer has created them. The figure below illustrates the output for the Microsoft Word Request pattern report.
