|

|
|
|
|
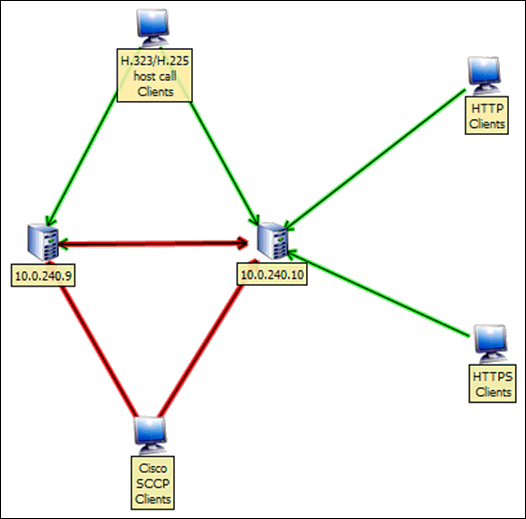
Using data from Application Performance Analysis, multi-tier applications can be automatically parsed and visualized as a diagram. Each diagram displays the observed dependencies of a multi-tier application, such as the servers involved and clients served.This feature is known as Application Dependency Mapping, and the key to its use is a single report element: the Application Dependency Discovery Diagram.