|
|

|
Time that Period! |
Day 2
Materials
Introduction
Students should again be encouraged to discuss the definition of a cycle or
periodicity. Students should recall the lab that was completed on Day 1 and
how it relates to determining the "period of the periodicity". In the lab,
they should have determined the length of time it took the pendulum to
complete one full cycle of its movement. That length of time is called the
"period" of the pendulum's behavior.
The students should now be ready to take all of this great information
they have learned in the previous day and apply it to data received by
high-energy satellites from various binary star systems. By properly analyzing the data, they will be able to determine the rotation period of a star
and/or the binary orbital period of the stellar system.
The astronomical objects used in this lesson may be unfamiliar to you and your
students. Never fear! You can read all about these objects at:
Another excellent way for students to visualize the behavior of a pulsar
and its relation to a light curve is by using a student holding a flashlight,
the Calculator Based Laboratory (CBL), its light probe,
CHEMBIO program (ftp://ftp.ti.com/pub/graph-ti/cbl/programs/83/), and the Texas Instruments (http://www.TI.com/) 83 graphing calculator (TI-83). Have the student hold
the light and rotate around with it pointed out toward his classmates...
sweeping across the light probe as she/he rotates. As the rotating beam of
light sweeps past the observer/probe, one is able to detect an increase in
the intensity of light you see from the flashlight. If some measure of this
brightness is observed over time and then plotted, a periodic behavior can
be noticed. The period of the behavior is a measure of the spin rate of the
person holding the flashlight. Have you students then consider how this
demonstration provides insight into the behavior of pulsars.
Tell me how to set up and run the CHEMBIO program!
For the next part of the lesson, the data will not be as easy to work with
as the lab with the CBL. We must now look closer at the data in order to
determine the period, as well as apply some mathematical methods.
Guided Practice - PART 1
Now ask students, "What would we do with data like these?"

Teachers: Want to know more about GX301-2!
Ask, "Do you see the measured brightness of the source 'repeating' itself?
Where? Describe what seems to be happening", and "Can you determine the
period here?". By being able to interpret the graphed data, students will hopefully respond with answers close to 700 seconds - which
is the correct length of the period. But now mention to students that
there has to be a way to be more mathematical method to determining a
period within a set of data -- something better than just guessing or being able to see it with your eyes!
Procedure
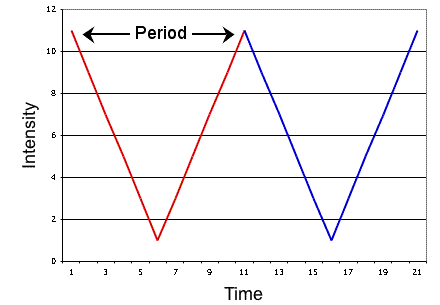
Here are some sample data points (in increments of 100,000) over time (in
months). Is there periodic behavior in these data? If so, what is the period?
| Time | 1 |
2 |
3 |
4 |
5 |
6 |
7 |
8 |
9 |
10 |
11 |
12 |
|---|
| Intensity | 11 |
9 |
7 |
5 |
3 |
1 |
3 |
5 |
7 |
9 |
11 |
9 |
|---|
|
|
|
| Time | 13 |
14 |
15 |
16 |
17 |
18 |
19 |
20 |
21 |
22 |
23 |
24 |
|---|
| Intensity | 7 |
5 |
3 |
1 |
3 |
5 |
7 |
9 |
11 |
9 |
7 |
5 |
|---|
Students should copy these data on their paper and create a line plot on
graph paper.
Now the students are ready to determine the true, mathematical period
through the method of Folding. The following 8 steps are
for the student to follow. You may want to make photo copies or instruct
students to copy them from the overhead.
- Guess the length of the period.
- Locate that section of the plot. Color over the line it makes with a
red pencil.
- Locate the exact & adjacent match to that curve. Color over the line
it makes with a blue pencil.

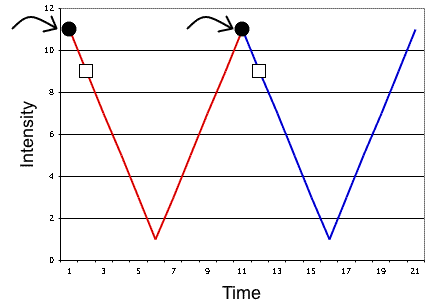
- Always starting from the left end of the x-axis, find the 1st data point
on the red curve and the 1st data point on the blue curve and determine the
mean of their y values (in this case, intensity is the y value). We
will call it's x-axis value "Time Bin #1".
Continue to do this with the remaining points on the curves, calling the x-
axis values "Time Bin #2", "Time Bin #3", etc. and associating the y value
of mean with the x value "Time Bin".
|
The two black dots represent the first locations on adjacent curves. The white squares represent the second two.

|
- Create a chart that looks like this and import the appropriate, calculated
data.
| Time Bin | Intensity |
|---|
| 1 | |
| 2 | |
| 3 | |
| 4 | |
| 5 | |
| 6 | |
| 7 | |
| 8 | |
| 9 | |
| etc. | |
- Plot the data from that chart.
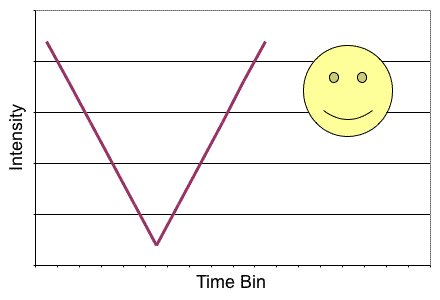
- Does it make a curve? Does it resemble the plot of your guessed period?
If so, you have the period!

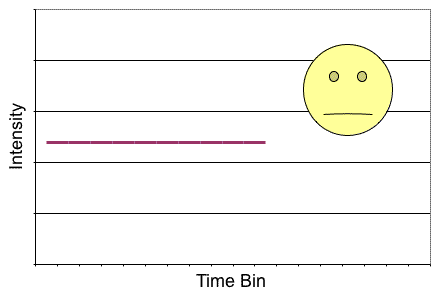
- Does it make a straight line, or an approximate straight line? If so, the
period you guessed is wrong and you need to go back to step one of the
Folding instructions and begin again.

The correct period for these data is 11 months. The teacher should
show both an example of correct Folding and an example incorrect Folding
as well.
Tell students that they now need to copy (or have a photocopy of) the GX301
-2 data and create a line plot on graph paper.
Next tell students to use Epoch folding to confirm the period of GX301-2.
Show me the answer here!
Guided Practice-PART 2
Another option for this lesson is to follow the procedure of Folding,
but now the teacher should use spreadsheet software or the graphing calculator.
Tell me how to do this!
Independent Practice
The students are now ready to complete the Folding on all of the data of
each binary star systems listed below.
- Orbital Period
Using data from an observation of Cir X-1 and one of GX 301-2, determine their oribtal periods.
- Teachers: Want to know more about Cir X-1 ?
- Teachers: Want to know more about GX 301-2 ?
- Stellar Rotation Period
Using data from an observation of Cen X-3 data and one of GX 301-2 data, determine their stellar rotation
periods.
- Teachers: Want to know more about Cen X-3 ?
- Teachers: Want to know more about
GX 301-2 ?
The students are ready to determine the orbital and stellar rotation
periods through the method of Folding. The 8 steps of Folding should be
used. It is probably worthwhile to review these steps at this point.
The teacher should also instruct the students to Fold the data sets in the
following order:
- The Cen X-3 stellar rotation period data here, trying the following
periods; start at 3.6 seconds and add multiples of 0.6 seconds after that,
such as 3.6, 4.2, 4.8, etc.
- The GX 301-2 stellar rotation period data here, trying the following
periods; start at 650 seconds and add multiples of 25 seconds after that,
such as 650, 675, 700 etc.
- The Cir X-1 orbital period data, trying the following periods; start at
14.6 days and add single days after that, such as 14.6, 15.6, 16.6, etc.
- The GX 301-2 orbital period data, trying the following periods; start at
35.5 days and add multiples of 3 days after that, such as 35.5, 38.5, 41.5,
etc.
In addition, the teacher may want students to create their own "Plot of a
Period" on graph paper and determine it's period in seconds using the
method of Folding. They should also create and write a "real world"
situation to match the plot, and prepare to present their findings to the
class.
Enrichment - The Chi-Square Test
This method is one that is commonly used by scientists every day when
they need to determine a period within a set of data. This method is one
that teachers may choose to use in their pre-calculus, calculus, or AP
physics classes. In this enrichment activity, we will demonstrate how
students can use the chi-square equation to calculate the value for
chi-square at any guessed period... just like a scientist would do!"
Tell me more about the Enrichment!
Extension - Using Student Hera to Analyze More Data Sets
Student Hera gives students the opportunity to analyze the same
data sets that scientists use, using the same tools that scientists
use. The Student Hera web pages walk students through examining the
data files and finding the periods using epoch folding tools.
Take me to Student Hera
|
