Introduction to X-ray Astronomy
Looking up in the sky you can see many objects, including stars, planets, asteroids, shooting stars, nebulae. The nearest star to Earth (besides the Sun) is 4.3 lightyears away (25 trillion miles), far too far to imagine visiting. Luckily we receive much information from the things found throughout the Universe in the form of electromagnetic radiation, or light. This radiation ranges from infrared light, visible light, ultraviolet light and X-rays and Gamma rays. The entire range is called the the electromagnetic spectrum, and it is a powerful source of information. What kind of information can we divine from the electromagnetic spectrum? The three different kinds of data are images, spectra, and light curves. You may already be familiar with images of objects in the universe: planets, stars, galaxies, nebulae, etc. Here are some examples of data in the form of images:
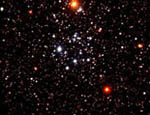
Optical Image of the Open Cluster M50 (http://apod.gsfc.nasa.gov/apod/ap970128.html)
(Larger image) |
X-ray Image of the Milky Way Galaxy (http://apod.gsfc.nasa.gov/apod/ap960102.html)
(Larger image) |
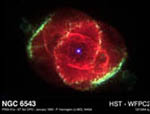
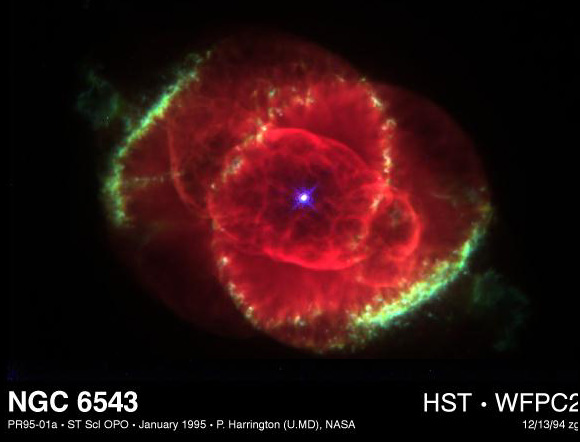
Optical Image of the Cat's Eye planetary Nebula (http://apod.gsfc.nasa.gov/apod/ap991031.html)
(Larger image) |
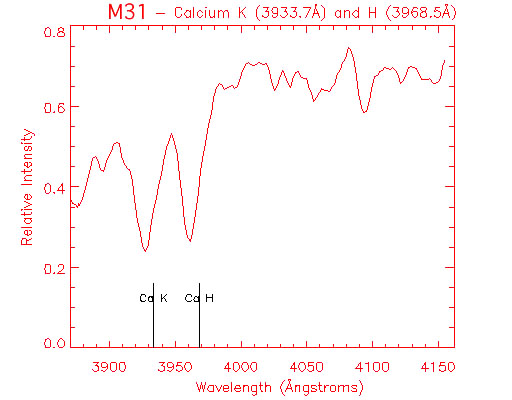
In addition to images, we can study the two other forms of data, spectra and light curves, to learn about the objects that emit the radiation we receive. Spectra are plots of the intensity (or amount) of light from a source at different frequencies. Think of it as a cosmic equalizer. Examples of spectra are:
The third kind of data are lightcurves. Light curves are plots of the intensity (or amount) of radiation received from a source as a function of time. This kind of data reveals to us how objects in the Universe change over time. Below is an example of a light curve.
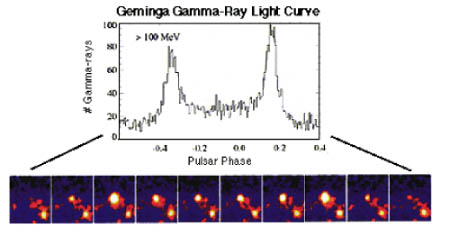
This figure shows time-lapse images of the Geminga pulsar (bottom) and how they translate into a light curve (top). |
All three kinds of data exist for the range of electromagnetic spectrum. High-energy X-ray data are especially interesting because X-ray photons come from the most energetic activities in the Universe, from black holes, neutron stars, and active galaxies, for example. X-ray images, spectra and lightcurves help us understand these exotic objects.
|


