|
File List
Let's first look at the FITs header, to see what it contains, and to practice using Hera. Click on File List in the left side of the Hera box. You can see from the description box that File List is a tool that displays the contents from a FITs table in an ASCII file, so you will be able to read the header directly. You have already selected the data set, so you can now click the "run" button to execute the File List tool. A parameter box will come up on the screen.
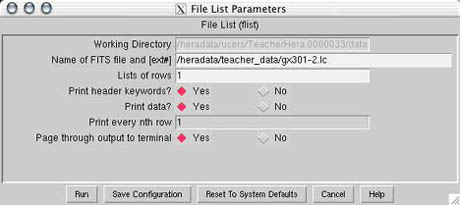
The file-name and directory should be filled in already. The radio buttons can be left in the default position. Under "List of Rows" type in 1 (this is the number of data rows that will be outputted. If you want to see a range of rows, you can type in, for example "1-5" to see rows 1 to 5 displayed). Click the "run" button. A new output window will appear with several screens worth of header information. You can see from a first glance that there is a tremendous amount of information contained in just the header (this is even before the first row of data). When File List is done running, scroll up to the top of the screen. Reading down the page you can see the information contained in the header of the FITs table. You can use the "search" feature of the help window to select specific text. After the header information, you will see the data displayed from the rows you specified. Under each row you will see the values for all seventeen variables displayed (it will not look like a row in this display, however!).
Each paragraph that follows is one row of data, one measurement. Try running File List again but look at several rows this time. Compare the numbers for the different rows. Notice that some of the values stay the same from one row to the next (such as TIMEDEL - at 90 seconds, the time the instrument observes in one position before moving on to the next patch of sky), while some, such as the RATE (the number of photons collected per second), vary.
|