| Log In | Not a Member? |
Support
|
|
Performance Issues: Memory UsageWhen the G4 arrived, the capacity for data processing with a PowerPC based machine jumped by an immediate 4, 8 or 16 fold. However, the CPU system bus did not at the same time see a similar throughput jump, until the G5 was introduced. As a result, the AltiVec developer must be much more sensitive to how and when she touches memory, because whether the data she needs lies in the caches or RAM may exert a profound influence on the speed of her function. Let us look at a sample function to better illustrate this issue, vec_add().
With a 2.0 GHz G5, the data consumption rate by vec_add() is (32 * 2000 MHz=) 64 gigabytes of data consumed per second and produce another 32 gigabytes per second of results at peak throughput. The peak bandwidth of the 1 GHz front side bus on a G5 is 3.2 GB/s in each direction (read and write). In the read direction, the difference is therefore 20:1, meaning that with everything operating at peak throughput, the code may be spending 95% of its time waiting for data to appear. Note: This is not an extreme example. It is possible to consume 1.5 times that much data per cycle in the vector unit. If one considers that data must also be written back out, then that number rises to 2 times. (Though on G5, writing to memory does not contend for bandwidth with reading memory.) Nor are functions like this uncommon. You can find examples of many memory bound functions everywhere, from the C Std. Library to linear algebra packages to audio and video. Note that the full throughput of 12.9 gigabytes per second cannot be reached even when the data is in the L1 cache. This is because the load / store unit can only achieve a throughput of one vector load per cycle. Thus, 6.4 GB/s is a more realistic top speed for read-only operations on G4. Nonetheless it reveals a substantial peak performance disparity between bus and CPU. On G5, we have two load store units that can operate in parallel and we can issue up to 4 non-branch instructions per cycle, so it is realistic to imagine code that does two loads and one add every cycle. You will not be able to issue two loads, an add and a store every cycle however, because that would require three load/store units.In general, the average developer will find that her code comes in two varieties. There will be a set that is Compute-bound -- the speed of the CPU is the limiting factor determining the speed of the function. There will also be a (probably larger) set that is I/O bound. When executing these functions, the CPU spends much or most of its time waiting for data to appear. Code micro-optimization can be helpful for compute bound code, but is generally a waste of time for I/O bound code. The best optimization strategy for I/O functions is to pay careful attention to how and when you use memory.
Optimize Memory Usage First, Micro-Optimize Code SecondAltiVec is not about 20 percent improvement. It is about 500 or 1000 percent. When 1500% or 2000% is potentially available, as in this case of the addition example above, you need to pay attention to it. This means paying strict attention to when and how you touch data. The only optimization strategy likely to give more improvement than that is careful selection of the right algorithm to save work, so by all means do that first. (For example, there is no reason to swap the elements in two large arrays, when all you need to do is swap the pointers to the array.) If you have two good algorithms, choose the one that makes better use of memory. Once your algorithm has been chosen, try to figure out how to optimize its usage of memory. A simple approach would be to simply reduce the amount of memory used. Another approach would be to structure your program to do more work on the data while you have it loaded into the caches. Do both, if you can. Doing More with the DataAs we have seen, very simple functions can spend most or nearly all of their time waiting for data to load from RAM. If your data is in the caches, then you are lucky. The time to access this data is much shorter. However data only appears in the caches if you have loaded it from RAM at some earlier time. Thus, at some point you had to have loaded that data from RAM the slow way.
Data can be pre-fetched into the caches using cache hints such as DST's
or The solution to this problem is to fetch the data into the caches ahead of time so that the load takes just a few cycles to complete and the instruction completion queue doesn't back up. As long as you are able to keep pre-fetching data into the caches ahead of time, your function will not stall and will gallop along at top speed.
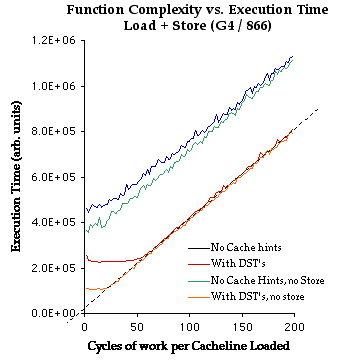
Though we said earlier that prefetch hints do not make the bus go any faster, they do help saturate the bus to make sure that it is always working. Without prefetch hints, there is always a delay between one set of loads and the next because we have to wait until we finish the calculation on the last cacheline before the function loops and is able to issue the next load. Thus, without prefetch hints, loading data through the system bus and execution can be thought to happen in series. With prefetch hints they happen more in parallel. We can see that with prefetching, code performs equally well for very complex calculations -- those that do more than 50 cycles of work per cacheline -- regardless of how much data is travelling over the bus. This slope simply represents the maximum speed the CPU can do the calculation. Above 50 cycles of work per cacheline loaded, the function is compute-bound. Below about 50 cycles, the red prefetch + store case plateaus. This is the point at which the calculation consumes data faster than the bus can provide it -- i.e. it becomes I/O bound. We see a similar thing happen for the orange line (prefetch + no store) at about 25 cycles. Because we are not doing any stores in the orange case, we are able to use all of the bus bandwidth for loads, rather than just half. This allows the orange line to achieve up to twice the throughput before bandwidth becomes a problem. Finally, take a look at the dotted line added to the plot that is co-linear with the orange and red cases. This shows what happens when we extrapolate that back to a work load of zero -- an indication of the amount of overhead in the function. By inspection, it seems to cross the Y axis at about 3-5 cycles of work. This is consistent with loop overhead and a few cycles for a pair of L1 cache hit vector loads. From this we can draw a very interesting conclusion: When a function is compute bound, the overhead for loading the data into the cache from RAM is near zero, if and only if you prefetch the data. That is a very important observation. Expanding that out to its logical conclusion, it leads to the following principles (valid when you prefetch data): It should be clear then that the fastest AltiVec functions are those that do more. 50 cycles is a HUGE amount of time to fill with calculations on 32 bytes. Most AltiVec functions do not do that much work. (There just isn't enough to do!) This means that any more work you can find to do on data loaded into your function can probably be done for free. Look for ways to combine many small functions into one larger function that does everything in a single pass. You may also be able to afford a more costly calculation that gives better results for near zero net cost. If it is likely that your data is not to be found in the caches -- perhaps because it is too large -- then micro-optimization of that code is also likely to be unproductive. The real bottleneck is loading the data. This is why this section begins with a title that urges you to optimize for best memory usage before doing any micro-optimization. Please note that this discussion concerns those functions that touch memory only. Small AltiVec functions that pass data in and out by value in register wont have these problems. Also, do not let this discussion cause you to be afraid to use the caches if you need them. Some complex functions are not able to fit everything in register, and so will need to use a little bit of space to temporarily hold data. This can be a good strategy. The caches are very fast. Use them when you need to. Finally, please note that the point at which the prefetch accelerated functions plateau is machine dependent. The same red prefetch + stores function running on a G4/400 may plateau at 35 cycles rather than 50. The G4/400 enjoys a smaller bus speed multiplier between system bus and CPU clock. If clock speed ratios continue to grow, it seems likely that it will require increasingly more complex functions to be compute bound.
Reducing Memory UsageThere are many different methods to reduce the amount of memory you use. The simplest example would be to just pick algorithms that use less data and storage formats that use less space. AltiVec friendly storage formats It is also important that your data be arranged so that your work is on adjacent data and not data scattered throughout the array. Scattered loads and stores as always get very poor use of the caches and tend to be quite slow. They also do not have much parallelism to them. Try to avoid algorithms that do a lot of scattered access to memory. Sometimes you will find that sparse calculations are beaten by brute force ones applied to the entire data set, even if for many individual data, the brute force calculation does nothing. Memory Consuming "Optimizations" A lookup table is another such strategy. We earlier demonstrated that you can complete at least 16 vec_adds, and perhaps as many as 50 in the time it takes to load one cacheline from RAM. Thus, it should not be surprising that a brute force calculation is faster than data lookup in many cases. Brute force methods are also more friendly to other parts of your application because they do not load lookup tables. Lookup Tables may displace other important data from the caches. Finally, lookup tables are not usually parallelizable. using AltiVec, so when you use a lookup table, you will be in effect be installing a scalar code bottleneck in front of your high throughput vectorized function. Exceptions are those lookup tables that are able to load all 4, 8 or 16 lookups with a single load, or those lookup tables implemented using Code Counts Too Globals and Constants Constants also frequently trigger a load from storage if the compiler can't figure out how to generate the constant quickly. If you can figure out how to synthesize the constant in four or fewer cycles without triggering a load, in general, you will be better off if you do so. If you can remove all of the loaded constants from your function, some compilers may be able to save a few cycles by doing an abbreviated stack frame creation. In one example, we found this up to doubled the speed of a small function. Every use of Stores Can Cause Unnecessary Bus Activity You can introduce a cacheline into the cache without loading data over the bus if you use the Memory Usage and the CachesOnce you have paid to move data into the processor caches, it pays to know how much space is in there so you have some idea how long you can expect the data to be able to remain there before something else displaces it. The cache sizes are as follows:
In general, a least common denominator approach works best, choosing to try to live in 32k L1 or 256k L2. However, knowing the physical size of the caches is not always the complete answer. If a cache is 512kB, can you use up all of the 512 kB from a single linear 512kB buffer and expect to stay in the cache? Currently, no. Why? Long story: PowerPC caches are set associative. When you map an arbitrary cacheline from a N gigabyte memory space into a cache that is orders of magnitude smaller, multiple different pieces of memory have to map to the same spot in the cache. This can set up pathological situations where you bounce back and forth between two or more chunks of memory that compete for the same spot in the cache. As you touch each one, it flushes another one out. For N data accesses, you may take N cache misses. To solve this problem, cachelines are organized in sets. This means that the N gigabyte memory space maps into even fewer bins in the cache (meaning more probability of overlap), but each bin can hold many cachelines concurrently. This means you can simultaneously access many cachelines that map to the same place in the cache at once. Since code tends to bounce back and forth between only a small number of competing chunks of memory, this is usually a performance win. When the cacheline is added to the cache, some other cacheline in the set is pushed out. Which one is thrown out is usually decided based on least recently used (or a pseudo least recently used algorithm). A cache organized into sets that can each contain 8 cachelines is described as 8-way set associative. Caches are also physically addressed. This means that the address used to determine which set you land in is based on the physical address in RAM that the data is living in, not the virtual address that you the programmer sees in the debugger. There are virtual and physical addresses for the same byte? Yes. You use the virtual one. The hardware uses the physical one. Every load, store or prefetch hint goes through a address translation process in the load store unit hardware to translate the virtual address you provide to the actual physical address of the ram in hardware. This indirection makes possible features like virtual memory, memory mapping data on disk, protected memory, etc. The key thing to note here is that your data is likely mapping into a different set of cachelines than you might have expected based on the virtual address. How do these two design elements relate? A 512k cacheline aligned segment of physically contiguous data should always fit in a 512k cache, because the number of cachelines falling into each set will be totally evenly distributed. There will be 8 in each. A 512k stretch of virtually contiguous data, like what you would get from malloc, is unlikely to fit in a 512k cache, because the physical pages that they map are unlikely be completely evenly distributed. Some of the sets may end up with more than eight cachelines and spill out of the cache, other sets may only get a few. Assuming your range of contiguous virtual pages has a random physical mapping, then statistically speaking, you are only very likely to fit in the cache if your data size is somewhere in the range of 1/2 or 2/3 of the size of the cache. Since as demonstrated by our back-of-the-envelope calculation at the top of this page, code taking cache misses can be up to 20 times slower than code operating out of the level 1 cache, its doesn't take very many to severely degrade performance. If you ever noticed that your benchmark timings are highly inconsistent from run to run for certain data sizes near the size of the cache, that is likely why. If you want consistently fast performance on current operating systems (MacOS X.3, Panther, and earlier) it is best to keep your data sets or data tiles well under the size of the critical level of cache that is limiting your performance. This also speaks to the importance of running your benchmark applications multiple times (or allocating your buffers multiple times inside the benchmark loop) to look for page mapping associated performance variability. Speed differences between one single test and another might not be from that change in the code that you made, as you had assumed, they might be because the page mapping was different in your buffers from test to test. Once your test data set is much larger or much smaller than the cache size, then benchmark times will usually become much more reproducible. Additional Notes Regarding DCB*With the introduction of the G5, several things have changed. First and foremost the cacheline size is now 128 bytes on a G5 and 32 bytes on a G4. This means you must be careful with cache block instructions that change memory, such as dcbz. The old form of dcbz will continue to zero only 32 bytes of memory. It has no performance advantage on G5 because it does not operate on full cachelines and may result in a performance degradation. There is a newer dcbz form that means "zero the entire cachelines whatever the size is" that has an extra bit set in the opcode. This may provide a performance improvement on G5 in some situations. Care should be taken in its use however, since it zeros differently aligned, differently sized chunks of memory on G4 and G5, and if the cacheline size should change again in the future, a third alignment and data size possibility may be introduced. DCBA is no longer legal on a G5. The kernel traps the exception and emulates the instruction as a noop. This is expensive. Its use in AltiVec code should be avoided. DST instructions are serializing on G5, and if used inside an inner loop may be causing a multi-cycle stall. This is especially true if you are using multiple DSTs in concert. Since the new cacheline size on the G5 is similar to the most common DST prefetch segment size, code that needs to run well on G5 will likely be better served by replacing the DSTs with dcbt instructions. The G5 also introduces a special streaming dcbt instruction that may be used to begin a prefetch stream that reads in the part of a 4k page that appears after the address provided. Earlier processors will see this as a regular dcbt. Many functions work equally well on G4 with DST or dcbt. DSTs were just easier. Since they no longer quite perform as well on G5s, Apple recommends that you revert to using dcbt as your preferred method of prefetching. G5 also has 4 dedicated automatic hardware driven prefetchers that respond to consecutive cache misses and introduce short lived data streams. In many cases, these do quite well, and may obviate the need for prefetching. In some cases, they may interfere with your user initiated prefetches and cause performance degradation. These can be disabled for testing purposes by adjusting a bit in the HID special purpose registers, using the CHUD toolkit. You should not change these settings in a shipping application. Table of Contents |
||||||||||||||||||||||||||||||||
|
Get information on Apple products. Copyright © 2008 Apple Computer, Inc. |