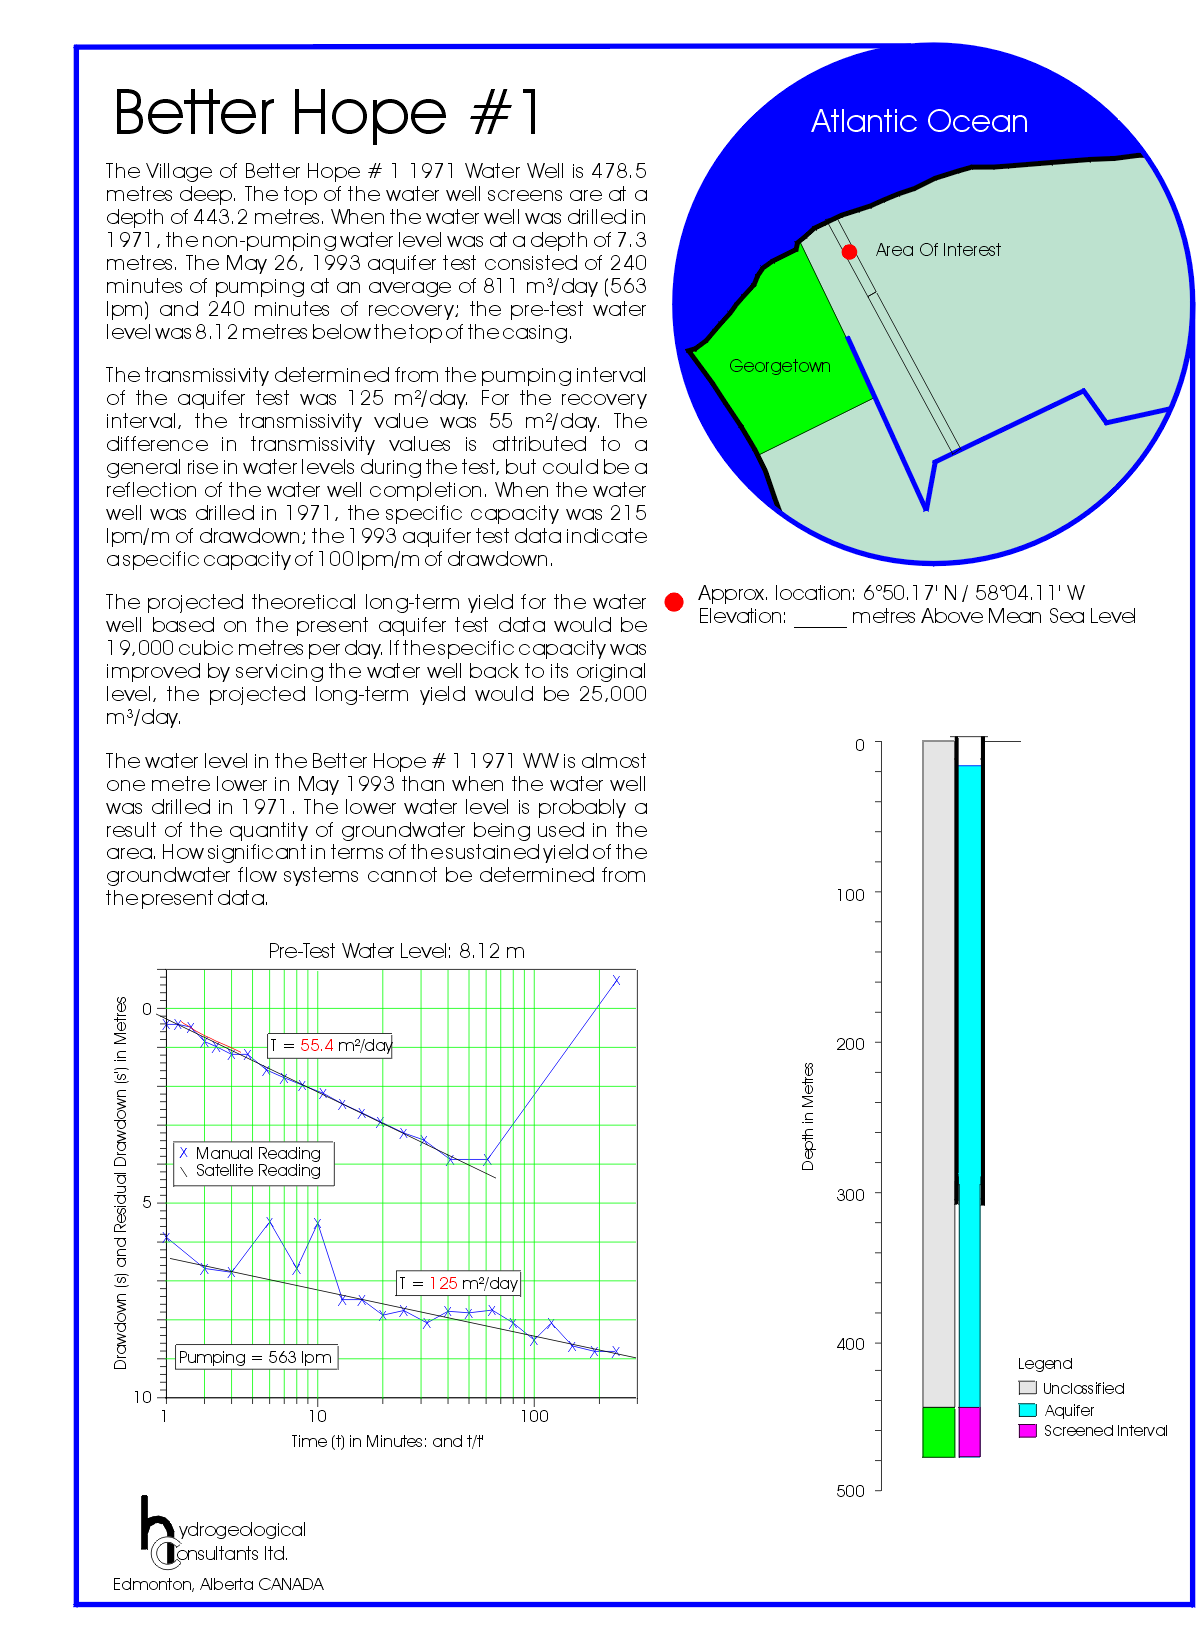
Labels:text | diagram | screenshot | plot | line OCR: Better Hope #1 Atlantic Ocean The Village of Better Hope # 1 1971 Water Well is 478.5 metres deep. The top of the water well screens are at a depth of 443.2 metres. When the water well was drilled in 1971, the non-pumping water level was at a depth of 7.3 metres. The May 26, 1993 aquifer test consisted of 240 Area Of Interest minutes of pumping at an average of 811 m3/day (563 Ipm) and 240 minutes of recovery; the pre-test water level was 8. 1 2 metres below the top of the casing, The transmissivity determined from the pumping interval Georgetown of the aquifer test was 125 m2/day. For the recovery interval, the transmissivity value was 55 m2/day. The difference in transmissivity values is attributed to a general rise in water levels during the test, but could be a reflection of the water well completion. When the water well was drilled in 1971, the specific capacity was 215 Ipm/m of drawdown; the 1993 aquifer test data indicate aspecific capacity of 1001pm/m of drawdown. The projected theoretical long-term yield for the water Approx. location: 6º50.17' N / 5804.11'W well based on the present aquifer test data would be Elevation: - metres Above Mean Sea Level 19,000 cubic metres per day. If thespecific capacity was improved by servicing the water well back to its original level, the projected long-term yield would be 25,000 m3/day. The water level in the Better Hope # 1 1971 WW is almost 0 one metre lower in May 1993 than when the water well was drilled in 1971. The lower water level is probably a result of the quantity of groundwater being used in the area. How significant in terms of thesustained yield of the groundwater flow systems cannot be determined from the present data. 100 Pre-Test Water Level: 8.12 m X 0 1 T = 55.4 m2/day 200 x Manual Reading \Satellite Reading Depth in Metres 5 300 T = 125 m2/day Pumping = 563 lpm 400 Legend Drawdown (s) and Residual Drawdown (s') in Metres 10 Unclassified 10 100 Aquifel L Time (t) in Minutes: and t/t' Screened Interval 500 hydrogeological Consultants Itd. Edmonton, Alberta CANADA