home *** CD-ROM | disk | FTP | other *** search
/ ftp.networkinstruments.com / 2015-02-04.ftp.networkinstruments.com.tar / ftp.networkinstruments.com / pub / demos / ObsReportingServerSetup.exe / Common / ObserverReportingServer.chm / images / ors_tutorials_example_client_graph.png < prev    next >
Portable Network Graphic  |  2013-04-19  |  82KB  |  706x618  |  16-bit (14,684 colors)
Labels: dialog box | monitor | window
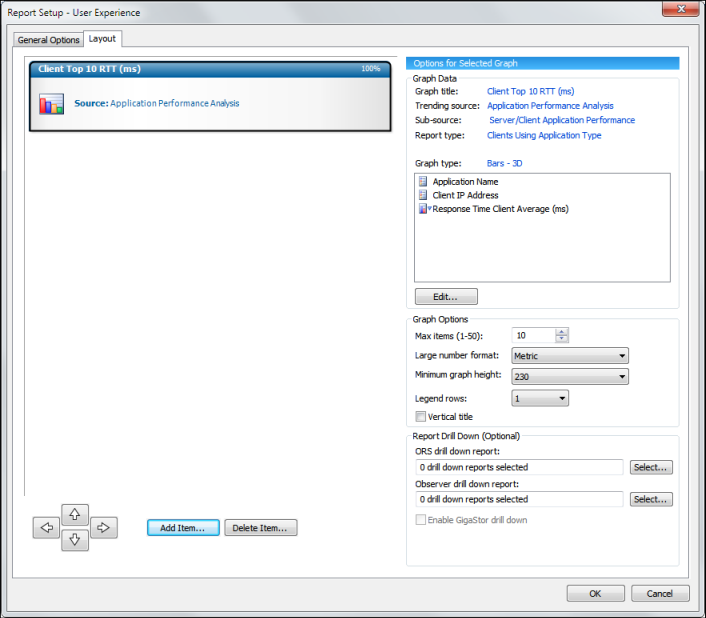
OCR: Report Setup User Experience General Options Layout Client Top 10 RTT ms 100% Ootions for Selected Graph Graph Data Graph tite: Client Top 10 RTT (ms) Source Application Pertormance Anaysis source Application Performance Analysis Sub. -source: Server /cieni Aoolication Performance Report tyoe Application Type Graph type: Bers Application Name Cienti Address "Response Time Clent Average (ms) Graph Options May items 1-50 Large number format: graph height: Legend rows Vertica tue Report Drill Down (Optional) ORS dril down report O drill down reports selected Select. Observer dri down Treport: 0 drill down reports selected valer Enable Add Item Delete Item. GigaStor drill down Cance Genera tile Applica tion Clients Using Cient vResponse Metric Minimum theight Vertical Dowr GigaStol Cancel