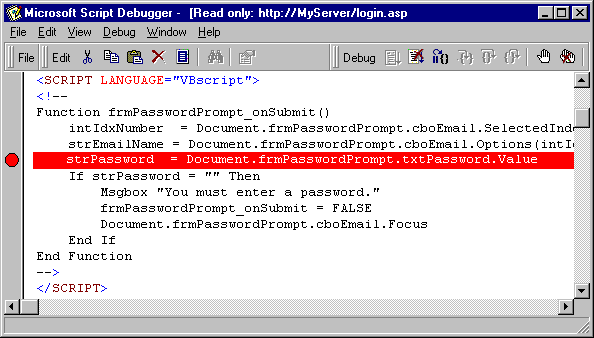
Setting Breakpoints
Setting a breakpoint allows you to specify where in a script you want to stop execution and start the debugger. For example, you might want to start the debugger at the beginning of a procedure or before a line that you suspect might cause an error.
You can set breakpoints on specific lines, which helps you to pinpoint problems at particular points in your scripts. You can also set a breakpoint on the first executable line in an HTML document or ASP page, which enables you to start debugging as soon the first line of script is executed. Setting a breakpoint for the first script statement in a document is particularly useful for debugging scripts that are executed as part of a documentÆs OnLoad event and for debugging ASP pages.
To set a breakpoint
-
Display the document in Microsoft Internet Explorer.
-
For client scripts, choose Source from the Internet Explorer View menu.
û or û
For server scripts, start the debugger as a standalone application, and then choose the document to work with. For details, see Starting Microsoft Script Debugger and Choosing a Document to Work With.
-
In Microsoft Script Debugger, place the insertion point in the line where you want the breakpoint.
Note If you are setting a breakpoint in a Java program, select the entire statement.
-
From the Debug menu, choose Toggle Breakpoint.
û or û
Click  on the Debug toolbar.
The line where you set the breakpoint is displayed in red to indicate that it is a breakpoint.

-
Repeat Steps 2 and 3 for each breakpoint you want to set in the document.
-
Switch to Internet Explorer.
-
For client scripts, perform an action (such as clicking a button) that will start the script you want to debug.
û or û
For server scripts, refresh the document in the browser.
The debugger stops at the first breakpoint it encounters. You can now execute (step through) lines one by one. See Stepping Through Scripts.
Setting a breakpoint for the first script statement in a document is particularly useful for debugging scripts that are executed as part of a documentÆs OnLoad event. The script in the handler for this event has already been executed by the time the HTML document has completed loading, and any breakpoints set after the HTML document has completed loading are lost when the document is refreshed. Therefore, use the following procedure to debug script statements in an OnLoad handler.
To set a breakpoint for the first script statement in a document
-
Display the document in Microsoft Internet Explorer, and then from the Internet Explorer View menu, choose Source.
The Microsoft Script Debugger opens with the current document visible in Source view.
-
From the Debug menu, choose Break at Next Statement.
û or û
Click  on the Debug toolbar.
-
Switch to Internet Explorer, and then refresh the document.
The debugger stops at the first script line that is executed.
Note You cannot use this method to set breakpoints in the Global.asa file. For information about how to debug scripts in the Global.asa file, see Debugging the Global.asa File.
See Also
Clearing Breakpoints
Executing Script Commands
Stepping Through Scripts
Viewing and Changing Values
 on the Debug toolbar.
 on the Debug toolbar.