Previous
TOC
Index
Next
| DirectX Media for Animation Programmer's Guide |
Previous |
TOC |
Index |
Next |
Typical programs written in Direct Animation construct behaviors that generally have a very large number of "nodes," often on the order of thousands. To deal with this complexity programmers typically adopt a means of visualizing or thinking about what a behavior is. There are a number of ways that people tend to characterize behaviors. Each of them have their pros and cons. These are discussed below.
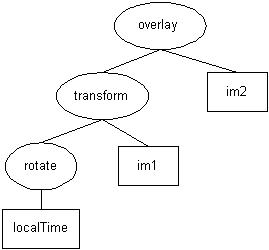
One way to visualize a behavior is as a directed graph, where media values are constantly and continuously flowing among nodes. In this context, Direct Animation shares commonalities with other dataflow architectures such as AVS and IBM Data Explorer. One distinction is that events can change the topology of the flowgraph. Also note that there is a fundamental stylistic difference between the way Direct Animation behavior graphs are constructed and the way most dataflow architecture flow graphs are constructed. In Direct Animation, the expression:
im3 = overlay(im1.transform(rotate(localTime)), im2);
would have the following graph:

In a dataflow architecture, it might be constructed like this:
rotateNode = new Rotater;
rotateNode.in.connect(localTime);
imageTransformer = new ImageTransformer;
imageTransformer.in1.connect(im1);
imageTransformer.in2.connect(rotateNode.out);
overlay = new Overlay;
overlay.in1.connect(im1);
overlay.in2.connect(imageTransformer.out);
im3 = overlay.out;
Typically, this sort of representation is much more verbose and unwieldy than the directed graph.
The notion of a graph with media values flowing through it, whose topology is changing upon events, is often a useful way to visualize Direct Animation behaviors. The "scene graph" architectures for graphics systems (such as Direct3D Retained Mode and PHIGS) often take a similar view.
Individual sub-behaviors of a Direct Animation behavior are similar to cells in a spreadsheet. Non-leaf behaviors (those that are defined in terms of other behaviors) are analogous to spreadsheet cells that reference other spreadsheet cells. Changes to any cell are reflected in all the cells that reference it. For instance, the behavior discussed above could be represented, using a spreadsheet as:
| Cell | Value |
| A1 | im2 |
| A2 | localTime |
| A3 | rotate(A2) |
| A4 | transform(A1, A3) |
| A5 | overlay(A4, A1) |
A spreadsheet user typically doesn't think about the underlying spreadsheet model as a directed dependency graph, although in fact that's what it is. One of the unique virtues of the spreadsheet is that it enables the user to think beyond the graph representation that defines the spreadsheet model, and think in the much more concrete terms of cells and relationships between cells. One can, therefore, construct models using a spreadsheet interface that are considerably more intricate than if they were modeled using the direct construction of a dependency graph (perhaps via a tool that exposed nodes and connections between nodes).
Of course, Direct Animation is very different than a spreadsheet. There is no tabular layout in Direct Animation, the "cells" continuously vary with time, and there are many different types supported in Direct Animation while spreadsheets typically only support a few concrete types such as numbers and strings. However, the core similarity of building interrelationships between elements that persist over time remains.
Another way of visualizing Direct Animation behaviors is to simply think of the behavior as a value, and not to think at all about the underlying connectivity model as a graph or as a spreadsheet.
An example of this, independent of Direct Animation, is simple arithmetic. Consider the algebraic expression x = 3y + z2. This expression is simply a "naming" of the expression 3y + z2 to x, and is not meant to imply assignment, as in C++ or Java. Thus, x really is 3y + z2, even as y and z change with time.
This algebraic expression isn't typically depicted either as a graph or as an abstract syntax tree represented by these operations. Nor is it depicted as a spreadsheet expressing these relationships. Generally, it is simply interpreted directly to say that x is three times y plus z squared. Thinking about behaviors in these simple terms allows the use of arithmetic expressions to build up complex relationships without overwhelming the user with these complexities.
In the context of Direct Animation, this means that the expression "c = sin(localTime)" just is "the sine of time". It's not "a new filter node holding the sine function, whose input pin is the node named localTime", nor is it "a new spreadsheet cell equal to the sine function applied to the spreadsheet cell named localTime".
Similarly, the expression:
im3 = overlay(im1.transform(rotate(localTime)), im2)
just is "im1 rotating, overlaid on top of im2."
None of the three interpretations is right in any absolute sense. They each have their advantages and weaknesses. We have found that the directed graph metaphor is useful in the early stages of learning the system. It helps a programmer be very precise about how the application works. The spreadsheet metaphor is useful as the programmer becomes moreexperienced. It allows complex relationships to be expressed without the extra baggage of creating a physical graph of all the relationships in the application. Finally, the algebraic/value-based metaphor is the most helpful. It frees the programmer from having to think about either a physical graph, or a complex web of dependencies. It allows the simple and direct expression of the programmer's intent.
![]()
© 1997 Microsoft Corporation. All rights reserved. Legal Notices.