The Analysis module provides you with a wide variety of graph styles in which to display results of many of your calculations. This appendix describes these charts and explains how to set their properties to customize them.
When the Analysis module creates a graph, it organizes the data as follows:

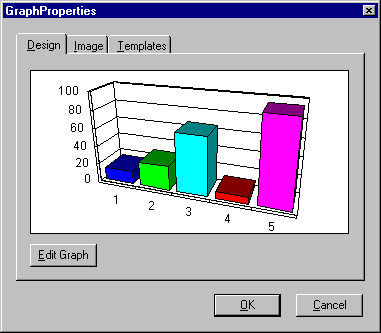
A sample of the current graph design is always displayed at the bottom of the presentation tab. To edit this graph design, choose the Edit Graph button. The gallery property pages appear.

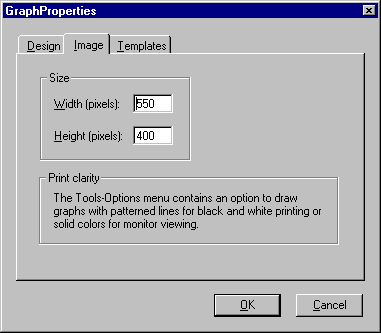
You can adjust the graph’s width and height by specifying the number of pixels for each in the boxes on the Image tab. (The default graph dimensions are 550 pixels wide by 400 pixels high.)
Note
A pixel is one dot on the computer display screen. Images comprise hundreds of pixels, so small that individual ones usually are indistinguishable.
