![]()
Process Controller is a system tray-based utility to monitor and control the activity and resources of your system in real time. With it you can...
 When run, Process Controller appears in the system tray showing two small meters. The left-hand meter shows the current processor utilisation; the right-hand meter shows the current memory load. Note that from Release 3.0, the memory load is the amount of physical memory currently in use, not total memory. If this bar is completely filled with colour it means your PC is out of physical memory and will start paging memory to and from disk.
 You can change the meter colours as well as selecting to just display processor usage. On dual processor or hyperthreaded systems the left-hand meter is split into two smaller meters showing the current load for each processor.
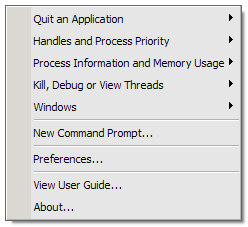
When clicked, Process Controller pops up its main menu. This menu provides complete access to all of Process Controller's functionality. Note that all menus in Process Controller work slightly differently to most other menus in Windows applications in that clicking on a sub menu parent item (that is, an item that opens a sub menu) will select a particular function rather than opening the sub menu. What happens when a parent item is selected is described in the various sections below.
The Quit an Application menu will initially ask the selected application to close cleanly by posting a WM_CLOSE message (these are message sent by Windows when the user clicks the close button on a window) to each window the application has created. This menu displays more applications than appear in the Windows Taskbar as it uses different criteria when selecting the processes to list. Note, however, that not all running processes can be closed in this way; processes which run at a higher privilege level, or have not created any windows are not displayed.
After attempting to cleanly close the application, Process Controller will wait a short amount of time - if, after this time has elapsed, the application is still active, Process Controller will offer the option of terminating the application immediately.
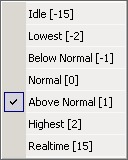
The Handles and Process Priority menu displays the number of open handles each process has along with a sub menu that shows the current priority class. There are six (four on Windows NT4.0) classes that each process can belong to: Idle, Below Normal, Normal, Above Normal, High and Real Time. For processes that will allow the priority class to be changed, this can be done by selecting the required option from the sub menu.

Generally speaking, all processes should run at Normal priority. However, some processes (for example, the logon process and Task Manager) run at a higher level to ensure they're always accessible. Extreme care should be taken when setting processes to run at Real Time priority as this could lead to other system-critical processes failing. Some processes (as can be seen in the screenshot above) run at custom base priorities - usually these are core system processes that cannot be modified. For these processes the custom base priority is displayed at the end of the menu.
The Process Information and Memory Usage menu allows access to a number of different features. Firstly, the menu itself displays each running process and the amount of memory it is consuming:
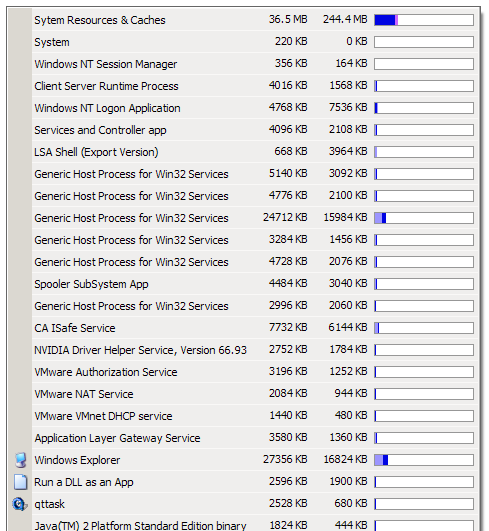
The first entry - labelled System Resources & Caches - is a special case. The value to the right displays the total amount of memory Windows has commited (that is, page file plus physical RAM). This value is returned by a Windows API call, and should match the 'Commit Charge' value displayed in Task Manager. The value on the left is the sum of the memory in use by all running processes subtracted from the commited memory value - it would be sensible to expect this value to be effectively zero, however Windows maintains a block of memory that it uses to cache applications so they start faster on subsequent uses. The blue section of the meter shows the sum of the memory used by all processes; the purple part shows the cache size compared to physical memory. Hence, if this meter is completely full, all physical memory is in use and the operating system will begin to page memory to disk.
In the screenshot above, 244.4MB of memory (page plus physical) is commited, and 36.5MB of that is cache (in other words, the running processes accounted for 207.9MB) - the 207.9MB is represented by the blue part of the meter; the 36.5MB of cache by the purple part.
The remainder of the menu displays the memory usage of each process. The value to the left shows the working set size of the process (this is the number of bytes of pages of memory recently touched by the process) and is traditionally taken to represent the actual memory usage of the process. This value should match the 'Mem Usage' value in Task Manager. The value on right represents the amout of page file currently used by the process and is becoming more popular as a means of monitoring memory usage of applications. This value should match the 'VM Size' value in Task Manager. The coloured bars represent these two values with light blue representing the working set size and dark blue representing page file usage.
Selecting an item from this menu will open a up a window detailing a bit more information about the process. The window will remain open until it is either closed or the process it represents terminates. It can also be made to stay on top of other windows by right-clicking anywhere within it and selecting the option from the menu that appears. Read more about this here.
The Kill, Debug or View Threads menu displays the amount of time each process is currently using. Pointing to a particular process will open a sub menu showing the amount of time each thread within the process is using and pointing to a particular thread opens a further sub menu which displays the current priority of the thread.

Processor utilisation is calculated by taking a snapshot of all the running process, then taking a second snapshot and recording the amount of time each process has used compared to the time between the two snapshots. Given this, any time not accounted for by this process is displayed in the Gone Processes item. Effectively, this item represents time used by processes during start up or termination.
Under Windows, a fake process runs with a Process Identifier (PID) of 0 that is used to account for idle time (time spent not running any processes) - this process is listed as System Idle Process in the menu. It's important to remember that this is not a 'real' process - to this effect the meters that represent the idle process are coloured green. On multi-processor or hyperthreaded systems one idle thread exists for each CPU (physical or virtual).
The rest of the processes are displayed with time spent in kernel mode in dark blue and time spent in user mode in light blue (or dark green and light green respectively for processes with a priority class of Idle). The total size of the meter (light and dark) represents the total amount of processor time being used.
Clicking on a process item will open a dialog asking what you want to do with it. Currently there are two options: you can either debug the process using NTSD, or you can terminate it. Note that terminating a process can cause system instability and loss of unsaved data. Windows may prevent Process Controller from killing certain system processes, in which case Process Controller will warn you that it couldn't kill the process.

Pointing the mouse on a particular thread will open a sub menu displaying the current priority the thread has within the process - seven standard priorities are defined, however threads can also be assigned custom priorities. If a thread has a custom priority, this will be displayed at the end of the menu - for threads that prevent their priorities from being changed the contents of the menu appear ghosted.

Currently, Process Controller can only change a thread's priority to one of the seven standard priorities. The actual priority a thread runs at is a combination of its priority, any thread boost applied to it, and it's parent's priority class. Further discussion is beyond the scope of this guide - however, thread prorities and scheduling are discussed in more detail here.
Clicking on a thread item will open a dialog asking you to confirm you want to kill it. Note that terminating a thread can cause system instability and loss of unsaved data. Windows may prevent Process Controller from killing certain system threads, in which case Process Controller will warn you that it couldn't kill the thread.

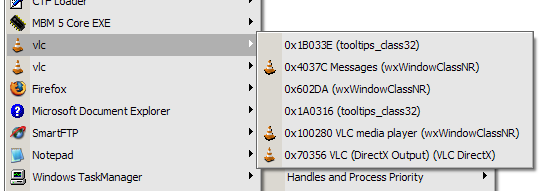
The Windows menu displays all the top-level windows created by a particular process. A top level window is one that can appear directly on-screen such as a menu, application window, tooltip, etc. For each window, it's handle and class are displayed, along with it's icon and title - if it has them.
Selecting an item from the list of processes will open a up a window detailing more information about the process. The window will remain open until it is either closed or the process it represents terminates. It can also be made to stay on top of other windows by right-clicking anywhere within it and selecting the option from the menu that appears. Read more about this here. Selecting an item from the list of windows will open a similar window that displays information about the window, as follows:
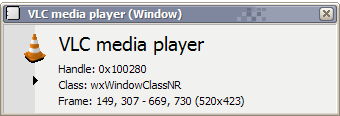
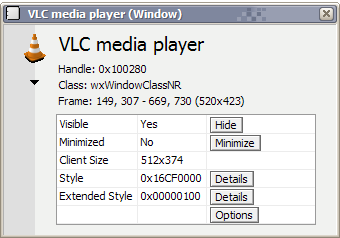
The window can be expanded and contracted to display either basic or more extended information about the window being monitored and it will remain on screen until it's either closed manually or the window it's monitoring is destroyed.
The Show/Hide button toggles the window's visibility and the Minimize/Restore button either shrinks the window to, or restores the window from the Taskbar. The two Details buttons display menus showing the current styles and extended styles the window supports, and the Options button displays a menu containing other operations that can be carried out on the window. The information displayed is continually updated so changes to the window's look and feel will be reflected in real-time.
Selecting a process from either the Process Information and Memory Usage or Windows menus will display a window similar to the following. This window will remain on-screen until it's either manually closed, or the process it's monitoring disappears. The window can also be made to stay above other windows by right-clicking anywhere and selecting the option from the pop-up menu that appears.
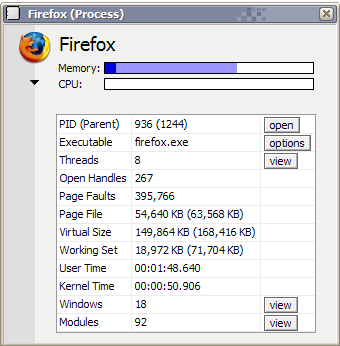
The open button opens the process' parent process - if it's still active - in a new monitoring window, the options button opens a new menu with some additional operations that can be carried out on the process, and the view button in the Threads row opens a pop-up menu showing the processor utilisation of each thread within the process.

If the process has any top level windows associated with it a view button will be displayed, clicking this button will open a menu showing all the top level windows the process has created, selecting an item from this list will open a monitoring window showing details of the window selected.

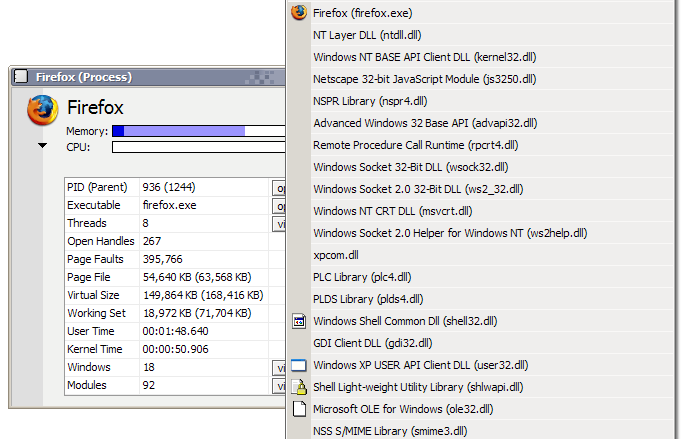
Similarly, if the process has any modules associated with it (all bar the kernel and idle processes have at least one module), clicking the view button will show a menu with all the modules (dynamic link libraries and other objects) the process has loaded.
There are some processes which always run under Windows, typically these processes cannot be killed or modified in any way:
Responsible for managing console windows, creating and deleting threads and parts of the 16-bit virtual MS-DOS environment.
Authenticates users for the Winlogon service and, if successful, generates the user's access token, which other processes the user initiates inherit.
Runs tasks at pre-determined times.
Starts the user session and launches both the winlogon and csrss processs. It also sets things such as system variables. Once it's launched winlogon and csrss it sleeps waitign for either of these two processes to end, it this happens under normal circumstances the system shuts down; otherwise smss causes the system to stop responding.
Manages spooled print or fax jobs.
Acts as a host for other processes running from dlls. More than one of these can exist in the system at any one time.
Responsible for starting, stopping and interacting with system services.
Runs kernel-mode threads.
A single-thread process whose job it is to account for processor time when the CPU isn't running other threads.
Responsible for managing user logon and logoff. Sleeps most of the time, only waking when the user presses CTRL, ALT and DELETE simultaneously, at which point it shows the security dialog box.
Or WMI as it's more commonly known. This process initialises when the first client application connects.
Threads are scheduled to run based on their scheduling priority. Each thread is assigned a scheduling priority, which ranges from from zero (lowest priority) to 31 (highest priority). Only the zero-page thread can have a priority of zero. The zero-page thread is a system thread responsible for zeroing any free pages when there are no other threads that need to run.
The system treats all threads with the same priority as equal. The system assigns time slices in a round-robin fashion to all threads with the highest priority. If none of these threads are ready to run, the system assigns time slices in a round-robin fashion to all threads with the next highest priority. If a higher-priority thread becomes available to run, the system ceases to execute the lower-priority thread (without allowing it to finish using its time slice), and assigns a full time slice to the higher-priority thread. The priority of each thread is determined by the following criteria:
The priority class and priority level are combined to form the base priority of a thread. To complicate matters further individual threads can be given a priority boost, which affects their dynamic priority - currently Process Controller ignores the dynamic priority of a thread.