|
|
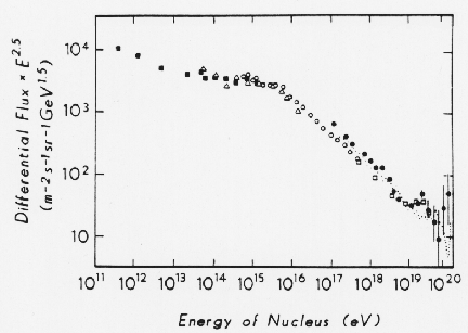
Cosmic Ray Spectrum and "the Knee"
 (http://heasarc.gsfc.nasa.gov/docs/rosat/gallery/misc_allsky1.html) (http://heasarc.gsfc.nasa.gov/docs/rosat/gallery/misc_allsky1.html)

This is a spectrum composed of measurements from different instruments
to cover the energy range from 1011 to 1020eV. It shows
the flux (numbers of cosmic rays passing through a surface) at different energies. The graph is
logarithmic; a straight line indicates that the number of cosmic
rays is proportional to the energy to some power , called the
spectral index . In the case of cosmic rays, there are fewer
particles at higher energies (the numbers go DOWN as the energy goes UP)
so the spectral index is negative.
The "knee" appears as a sharp turn in the slope of the line of data
points. In actuality, the turn is very slight, almost imperceptible when
viewed in normal units. However, the numbers of cosmic rays observed are
so great that the measurements are known with great accuracy, or the
error bars are small. The original graph is usually scaled so that the
knee is more obvious. This is only possible or believable because the
data are so robust.
The graph changes slope again at 10 20 eV, a fact which has
been confirmed with more recent measurements with newer instruments that
are able to capture cosmic rays with the highest energies.
This figure is figure 2.2 of Sokolsky, P. 1989. Introduction to
Ultrahigh Energy Cosmic Ray Physics. Redwood City: Addision-Wesley
Publishing Company.
Return to the Cosmic Rays page
|
