 (http://heasarc.gsfc.nasa.gov/docs/rosat/gallery/misc_allsky1.html) (http://heasarc.gsfc.nasa.gov/docs/rosat/gallery/misc_allsky1.html)
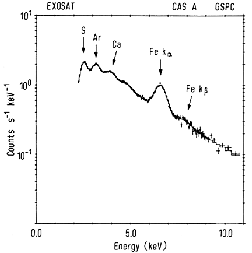
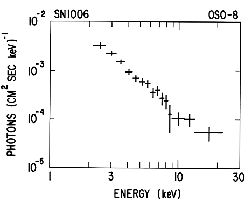
Spectrum Contrast - Thermal vs. Cosmic Rays
These two spectra show the difference between thermal and synchrotron
emission. In the thermal spectrum (top), many narrow features, or lines,
are apparent. These lines represent transitions between two distinct
energy states in a particular atom. It is possible to identify what
element is responsible for the emission from the energy of the line. In
contrast, the spectrum from synchrotron emission does not show these
narrow features, but appears as a straight line. There is more flux at
lower energies.
 (http://heasarc.gsfc.nasa.gov/docs/objects/snrs/casa_spectra.html) (http://heasarc.gsfc.nasa.gov/docs/objects/snrs/casa_spectra.html)
X-ray spectrum of Cas-A (http://heasarc.gsfc.nasa.gov/docs/objects/snrs/casa_spectra.html)
 (http://heasarc.gsfc.nasa.gov/docs/objects/snrs/sn1006_spectra.html) (http://heasarc.gsfc.nasa.gov/docs/objects/snrs/sn1006_spectra.html)
X-ray spectrum of SN 1006 (http://heasarc.gsfc.nasa.gov/docs/objects/snrs/sn1006_spectra.html)
Return to the Cosmic Rays page
|