|
|
Eclipsing Binary Light Curves
An X-ray binary is a special binary system where one of the stars is a
normal star but the other star is an odd star, an X-ray emitting neutron
star or white dwarf or black hole. By looking at the X-ray emission from
the system, which comes mostly from the X-ray star, we
can learn the size of the stars in the system.
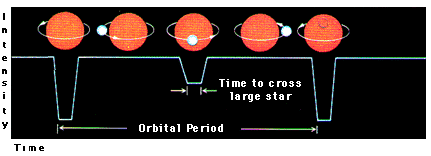
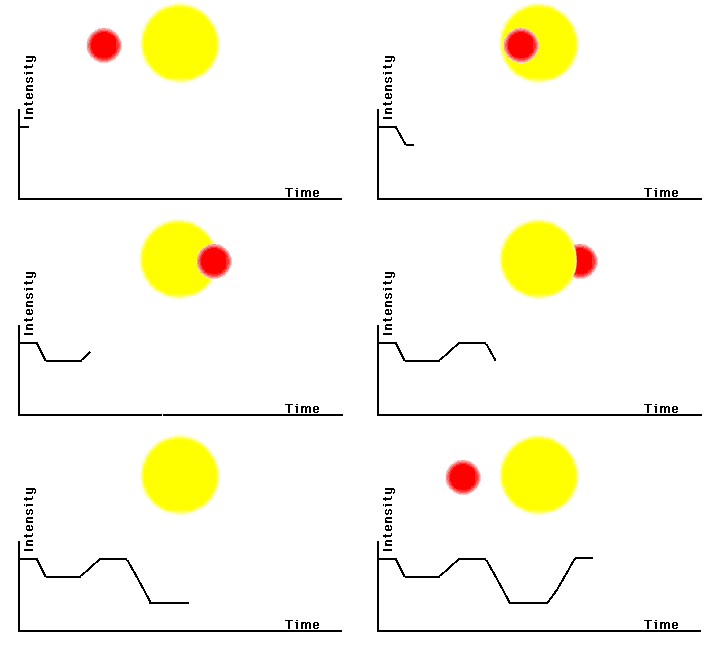
Below, there is a representation of a light curve as it would
appear from plotting data from eclipsing binaries. Above the
light curve is a diagram showing where the two stars in the system
are relative to each other (as seen by the observer). Notice how the
"brightness" or "magnitude" changes as the smaller star is behind, next
to, and in front of the larger star. The X-ray intensity of the system
is greatest when both stars are completely visible, and least when the
X-ray emitting star is eclipsed by the central star, which blocks out
the X-rays from the smaller star.


|
