Timing Analysis
What is Timing and Why is It Important in Astronomy?
Astronomy and astrophysics are the studies of the solar system, the Sun and
stars, galaxies, black holes, and the Universe as a whole. There is a
big difference between the science of astrophysics and the other
sciences, such as biology, chemistry and physics.
While most scientists can perform experiments where they change the
parameters of a system to see what the effect is, astronomers can
only observe what is happening to the objects they study.
Most people take some science classes where they perform laboratory
experiments. You may have measured the acceleration of a small ball
dropped from different heights in your physics class, or made simple
circuits to study voltage, current and resistance.
Maybe you studied how oxygen affects combustion in chemistry class. You
might have looked at your own cells under a microscope in biology, or
studied how animals react to different environments. These sciences
are called "experimental sciences" meaning that we can design
experiments to learn more about the objects or forces
under study.
Astronomers can't do this. They can't change the temperature of a star
and see what happens. They can't add more helium to the Universe and
see what the result is. They can't look at the Milky Way from different
viewing angles. They can't repeat the conditions of the birth of the
solar system, or the early Universe. The "experiment" is in
progress, and astronomers can only take the very best measurements
possible, and study them very carefully to infer what is going on in
the Universe around us. Astronomy is called an "observational science"
because everything we know about the Universe we learn through our
observations.

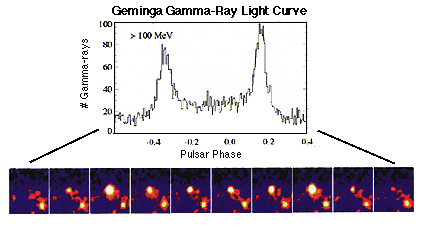
This figure shows time-lapse images of the Geminga pulsar (bottom) and
how they translate into a light curve (top).
Astronomy conducts scientific investigations of astrophysical systems
utilizing the electromagnetic radiation that they produce. The regimes of
imaging,
spectroscopy, and timing are used to study interactions of photons and matter
in the environment of virtually every astrophysical context including
normal stars, white dwarfs, neutron stars, black holes, galaxies, active
galactic nuclei, clusters of galaxies, supernova remnants, and the
interstellar medium. Imaging allows the spatial structure of extended sources
to be mapped and individual point sources to be resolved. Spectroscopy allows
measurement of temperatures, densities, chemical abundances, and ionization
states of the emitting regions. Timing data can be used to investigate
dynamical phenomena such as accretion flows, oscillations, and accretion disk
instabilities, as well as magnetic field configurations and instabilities in
compact and non-compact stellar systems and active galaxies.
Methods of Timing Analysis - Fourier, Folding, and Wavelet Analysis
Have you ever studied a musical instrument? If so, then you know
how important it is to tune your instrument. Perhaps you used a tuning fork.
A typical tuning fork used by musicians is for a pure A tone, of 440 Hz.
Have you ever wondered what that means? One Hertz (Hz) is one wave, or
cycle, per second. A pure tone like an A actually travels just like a wave
through the air, and your eardrum receives the signal as 440 waves per
second. Now imagine a musical chord. A C-chord is made up of the notes
C, E, and G. You could decompose the chord into three waves, each having a
different frequency in Hz. In fact, any sound can be decomposed into a
number of frequencies, some stronger and some weaker.
It turns out that sound is not the only type of data that can be
decomposed into a number of frequencies. Astronomical time series can also
be thought of in this way. Astronomers use a number of tools which allow
them to take time series data and look at it in terms of the frequencies
present in the data. This is useful to astronomers because it allows them to
determine periodic components of the data, that can then be related to
physical properties of the system, like rotation, binary period, etc.
One method used for getting frequencies from time series is to do
a Fourier transform on the data. This allows astronomers to visualize the
data as a large number of periodic components, each with a different period
and a different strength. Very strong components may appear in data where
there is a periodicity present. Astronomers then must estimate the
significance
of this feature, another way of saying how much confidence they have that it
is a true periodicity in the data. When astronomers are looking for new
phenomena, such as pulsars, they are very conservative in what they take to
be a real signal. A frequency has to be many times stronger than it would be
in a random data set to be taken seriously. A Fourier transform is based
on a mathematical theorem that any signal can be decomposed into an infinite
number of sine waves. This means that Fourier analysis works best when the
signal we are looking for is very similar to a sine wave.

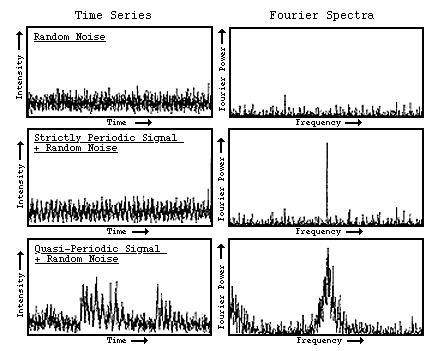
Fourier analysis of the time series on the left results in the Fourier
power spectra on the right. It is clear that the analysis does identify
the periodic behavior in the data. |
Another method that is useful for a signal with arbitrary shape is
epoch folding. This is done by chosing a range of periods, and "folding"
the data at those periods. What does this really mean? Say you have one
reading per second for 500 seconds. You want to fold this data on a period
of 25 seconds. To do this, you would start with the first 25 points, and then
add the second 25 points (points 26-50) to the first 25. Now add the third
set of 25 points, and so on, until you reach the end of the data set. If the
period you have chosen has nothing to do with a real period in the system,
then times where the signal is high will cancel out with times where the
signal is low in each of the 25 "bins", and the resulting epoch folded light
curve will look sort of flat and boring. If, however, 25 seconds is very
close to a period that is actually in the data, then bins where the signal
is high will add together, and bins where it is low will add together, and
the result will be a very nice looking epoch folded light curve. At this
point, the astronomer must again assess how significant the resulting light
curve is. This is generally done by looking at the spread of values, or
errors, in the typical bin, and comparing how much higher the high bins are
than the standard error.

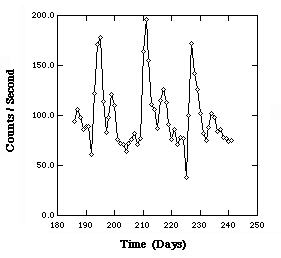
Light curve for the X-ray binary system Circinus X-1 taken by the
All-Sky Monitor aboard the RXTE satellite. |
Wavelet analysis is used primarily on signals where there are many frequencies
present in a data set, that may change with time. Both the epoch folding and
the Fourier techniques tell you only about what frequencies are present in
an entire data set, but nothing about how the strengths or values of these
frequencies may change with time. Wavelet analysis is designed to capture
time-varying frequencies and display it. Since you now have more information
than you did from Fourier or epoch folding techniques, you need to represent
the results of wavelet analysis differently. This is usually done in the form
of an image that tells us which frequencies were present at what times in the
data set. While wavelet techniques are very powerful in helping astronomers
uncover complex non-stationary behavior in data sets, they must be used with
caution. The extra information that can be gained comes at the cost of
increased difficulty in evaluating whether the result is significant. However,
the fact that many of the most intriguing astronomical data sets appear to
contain time varying frequency components demands that astronomers use every
tool in their time series analysis toolbox, including wavelets.
|
