

|
| Volume Number: | 4 | |||
| Issue Number: | 5 | |||
| Column Tag: | The Workstation Mac | |||
MatLab Comes to the Mac II 
By Paul Zarchan, Cambridge, Mass
Introduction
MATLAB is an interactive program to help with scientific and engineering numeric calculations. Although it was originally written in FORTRAN for mainframe computers, a second generation MATLAB was rewritten for smaller computers such as the Sun Workstation and the VAX computer. In the last few years a special version of MATLAB was developed to run on MS DOS compatable PC’s with math coprocessors. Typical uses for MATLAB are general purpose numeric computation, algorithm prototyping and solving special purpose problems with matrix formulations that arise in disciplines such as automatic control theory, statistics and digital signal processing. MATLAB is now available for the Mac II or for any Mac souped up with a 68020 accelerator board and a 68881 math coprocessor. For engineers this lends legitimacy to the claim that the Mac II is actually a workstation.
Unlike FORTRAN on the MAC, MATLAB is not really designed to make executable code (i.e. “double clickable” applications). As with interpretive BASIC, the MATLAB application is required on the disk to execute any file previously generated. Unlike BASIC, MATLAB is very fast because of the highly efficient algorithms. MATLAB allows engineers to solve problems almost as they are written mathematically and in addition allows easy access to libraries of some very powerful software. Some have called MATLAB “APL without the pain”. The Mac version of MATLAB takes full advantage of the Mac interface. This also means the MATLAB output can easily be incorporated into reports and presentations making MacMATLAB far more useful than the DOS version.
Matrix Examples
Matricies can be entered either in the MATLAB editor or by the carrot prompt by using brackets to define the matrix and semicolons to separate matrix rows. For example, by entering
»A=[1 2 3;4 5 6;7 8 0]
we get the MATLAB output on screen as
A =
     1     2     3
     4     5     6
     7     8     0
If we want to find the transpose of matrix A we simply type at the prompt
»B=A’
where the ‘ indicates transposition The resultant screen output is
B =
     1     4     7
     2     5     8
     3     6     0
Taking the matrix inverse of A is simple as typing
»inv(A)
which yields the screen output (nearly instantaneously)
ans =
   -1.7778    0.8889   -0.1111
    1.5556   -0.7778    0.2222
   -0.1111    0.2222   -0.1111
Many other matrix and linear algebra functions are available with MATLAB. Of course, many engineers have these functions built into their FORTRAN libraries - so why use MATLAB? Let’s do more examples to see why!
Polynomial Example
Suppose we had two polynomials and we wanted to multiply them and find the roots of the resultant expression. If the two polynomials were
x2+3x+2 and x2+x-12
we would define the polynomials in MATLAB by typing
»A=[1 3 2];
»B=[1 1 -12];
where the polynomials are expressed as vectors where the vector elements represent the polynomial coefficients in descending order. We can multiply the 2 polynomials algebraically in MATLAB by using the convolution function or
»C=conv(A,B)
which yields
»C =
     1     4    -7   -34   -24
The screen output displays the coefficients of the resultant polynomial in descending order. This means that the product of the 2 polynomials is given by
x4+4x3-7x2-34x-24
To find the roots of the resultant polynomial we simply type
»roots(C)
which yields the 4 roots as
ans =
    3.0000
   -4.0000
   -2.0000
   -1.0000
Still not impressed with MATLAB? Let’s look at more examples.
Plotting
Unlike FORTRAN, plotting functions come built into MATLAB. If we wanted to plot
y=sin(x) and z=.01x2 from -15 to 15 in increments of .05 only the following 4 MATLAB statements would be required
»x=-15:.05:15;
»y=sin(x);
»z=x.^2/100;
»plot(x,y,x,z)
The unenhanced screen output for such a set of commands appears in Fig. 1. Of course since MATLAB grpahical output is in the PICT format it can be copied to the clipboard and pasted into any Macintosh application.
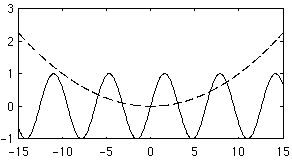
Figure 1 - Plotting With MATLAB is Easy
The graph can be embellished within the MATLAB environment (with features similar to Cricket Graph) or copied onto the clipboard and pasted into MacDraw for further enhancement.
If we wanted to show that a 5 term Fourier series expansion for a square wave is accurate (Gibb’s effect) we only need the following 3 lines of MATLAB code.
»t = 0:.1:10;
»y = sin(t) + sin(3*t)/3 + sin(5*t)/5 + sin(7*t)/7 + sin(9*t)/9;
»plot(t,y)
The resultant unenhanced MATLAB output is shown below.
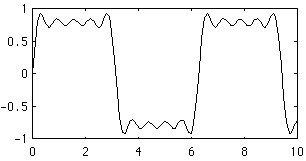
Figure 2 - MATLAB Output For Gibb’s Effect
Still not impressed? Suppose we wanted to evaluate the function

over the range
-2¾x¾2, -2¾y¾3
All we have to do is use the following 3 MATLAB statements to get a 3 dimensional plot (with all the hidden line algorithms transparent to the user) of the function.
»[x,y]=meshdom(-2:.2:2,-2:.2:3);
»z=x.*exp(-x.^2-y.^2);
»mesh(z)

Figure 3 - MATLAB 3 Dimensional Plot
Incidentally, the plot took only a few seconds to generate. Try doing that in FORTRAN!
Signal Processing
Noisy signals can be analyzed with MATLAB. For example, we can make 750 gaussian distributed random numbers with zero mean and unity standard deviation with the statements
»rand(‘normal’)
»y=rand(750,1);
We can then analyze and display the frequency content of the 750 random numbers with a MATLAB histogram statement or
»[n,x]=hist(y);
»plot(x,n,’+’)
As expected, the MATLAB output, shown in Fig. 4, demonstrates that the 750 random numbers follow the standard “bell-shaped” curve or well known gaussian distribution.
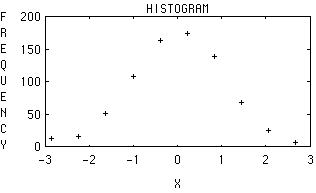
Figure 4 - MATLAB Can Make Histograms
As was mentioned in the introduction, MATLAB comes with very powerful algorithms. The next example shows a simple use of the FFT (Fast Fourier Transform) function. A common use of the FFT is to find the frequency components buried in a noisy time domain signal. Consider data sampled at 1000 Hz. We can form a signal containing 50 Hz and 120 Hz and corrupt it with gaussian noise (zero mean and unity standard deviation) with the following 5 MATLAB statements.
»t=0:.001:.5;
»x=sin(2*pi*50*t)+sin(2*pi*120*t);
»rand(‘normal’)
»y=x+2*rand(t);
»plot(y(1:50))
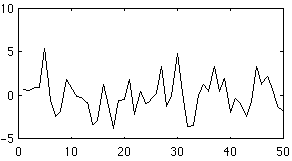
Figure 5 - Noisy Signal in Time Domain
It is difficult, if not impossible, to identify the frequency components by looking at the original signal in the time domain. Converting to the frequency domain, the discrete Fourier transform of the noisy signal y is found by taking the FFT. In MATLAB code this means
»Y=fft(y);
The power spectral density, a measurement of the energy at various frequencies, is:
»Pyy=Y.*conj(Y);
We can plot the power spectral density by forming a frequency axis for the first 256 points (the other 256 points are symmetric) with the MATLAB statements
»f=1000*(0:255)/512;
»plot(f,Pyy(1:256))
From the resultant output in Fig. 6 we can clearly see the frequency components at 50 Hz and 120 Hz of the signal.
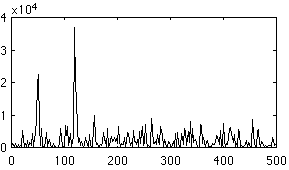
Figure 6 - Frequency Domain Output
Control Analysis
MATLAB can also be used in the analysis of control systems from both a modern and classical point of view. We can find and plot the root locus of the transfer function

for gains 0 to 10 in steps of .5 with the following MATLAB statements
»num = [.2  .3  1];
»den1 = [1 .4 1];
»den2 = [1 .5];
»den = conv(den1,den2);
»k = 0:.5:10;
»r = rlocus(num,den,k);
»plot(r,’x’), title(‘Root-locus’),xlabel(‘Real part’),ylabel(‘Imag part’)
The resultant root locus is shown in Fig. 7.
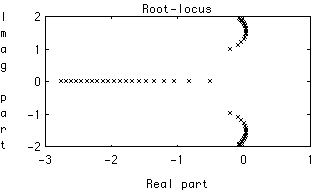
Figure 7 - Root Locus Example With MATLAB
We could find the step response for the same system by typing the additional statements
»[a,b,c,d] = tf2ss(num,den)
»t = 0:.3:15;
»y = step(a,b,c,d,1,t);
»plot(t,y),title(‘Step response’),xlabel(‘time(sec)’)
yielding the output of Fig. 8
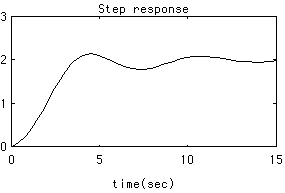
Figure 8 - Step Response Output
Another example of the control system analysis capability of MATLAB consider a second order quadratic transfer function with natural frequency 1 rad/sec and damping of .2. The MATLAB program required to display the magnitude characteristics is shown below and the resultant output is displayed in Fig. 9.
»[a,b,c,d]=ord2(1,.2);
»w=logspace(-1,1);
»[mag,phase]=bode(a,b,c,d,1,w);
»mag1=20*log10(mag);
»semilogx(w,mag1)
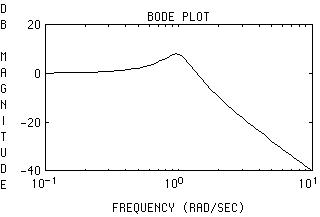
Figure 9 - Sample Magnitude Bode Plot For Quadratic Transfer Function
More Details
If you already used MATLAB in the DOS world and have a collection of many files there is no problem in porting them to the MAC. Just use a file transfer program (I used PC to MAC and Back) and the conversion routine (going from ASCII files to .m files) provided by MATLAB. The danger in doing this is that the DOS version of MATLAB will seem very primitive once you have used the MAC version. Incidentally the MAC version of MATLAB runs about 5 times faster than the IBM/AT version and at about the same speed as the Sun-3 Workstation version.
Macintosh MATLAB was developed by The Math Works, Inc. [20 N. Main St., Suite 250, Sherborn, Mass. 01770, (617)653-1415]. The software, including the signal processing toolbox comes on a single 800k disk (unprotected) with a list price of $895. The control and ientification toolboxes are sold separately - each with a list price of $495. Although this software is expensive by MAC word processing and spreadsheet standards - it is inexpensive by engineering software standards.


- SPREAD THE WORD:

- Slashdot

- Digg

- Del.icio.us


- Newsvine


