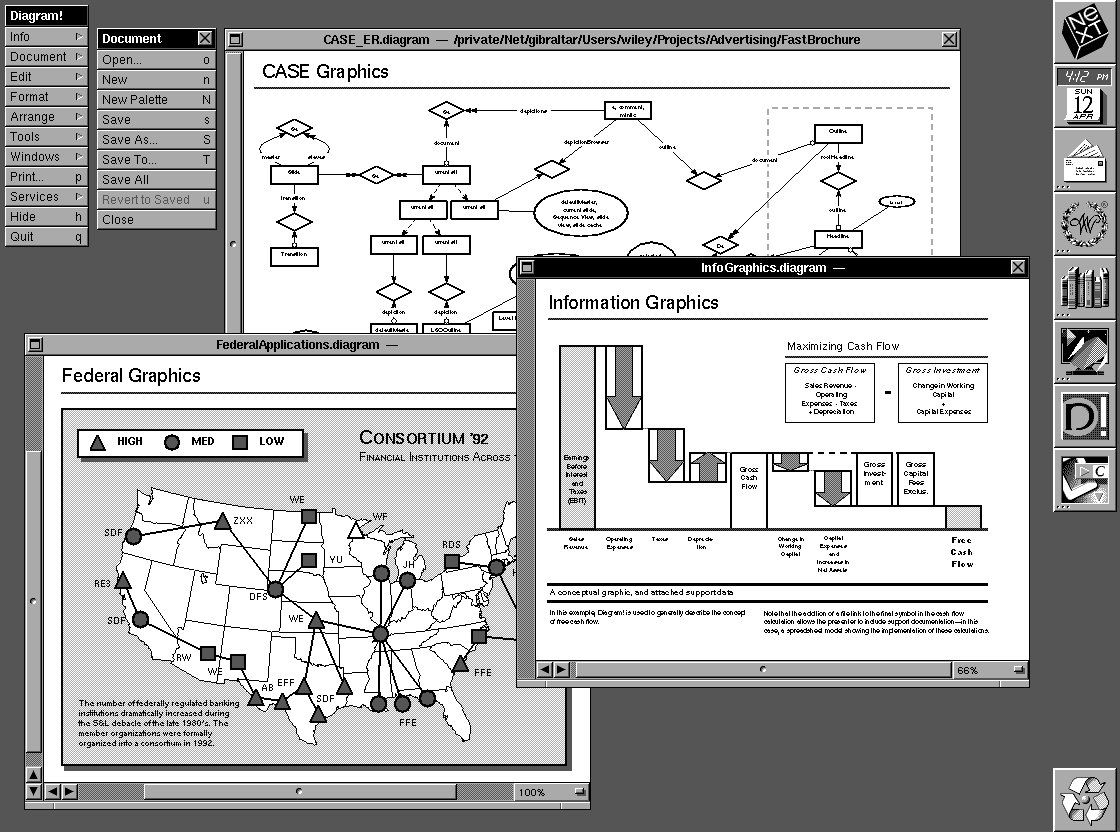
Labels:text | screenshot | diagram | plan OCR: Diagram! Info Document CASE_ER.diagram - /private/Net/gibraltar/Users/wiley/Projects/Advertising/FastBrochure X XT X Document D Open ... 0 Edit CASE Graphics New n 4.12 PM Format New Palette N SUN 12 Arrange Save s Tools Save As ... S Windows Save To ... T Print .. p Save All Services Revertto Saved Hide h Close Quit Hund Irel umul A Trendbon Info Graphics.diagram - X Information Graphics dupl doni dipldkn FederalApplications.diagram - Maximizing Cash Flow Federal Graphics Gross Cash Flow Gross Investment Sales Revenue . Changein Working Open Ing Experdes . Taxes + Deprecis Ion CapiblExpertos DI HIGH MED LOW CONSORTIUM '92 FINANCIAL INSTITUTIONS ACROSS Somng Before Gross GroPE ntoreal Gross Cash heat- Capital Flow ment WE ETCLE. EBIT ZXX SDF RDS Cpuwha Dipri d+ ChingH In Working Free Cash YU Flow RES DFS A conceptual graphic, and attached supportdata SOF WE In the example Diag em! is usedlo gonaally dos cibo lhe con cod d' free cash flow. Nololhal lho addlion of a flolink lolhoninal symbol in lho cash flow calculelion ellows the pres aler lo in dude support documentalion-in this caso, a spreadshod mode showing the implementation of Ihoso calculelias. FFE 66% AB EFF The number of federally regulated banking SDF institutions dramatically increased during the S&L debacle of the late 1980's. The FFE member organizations were formally organized into a consortium in 1992. 100%