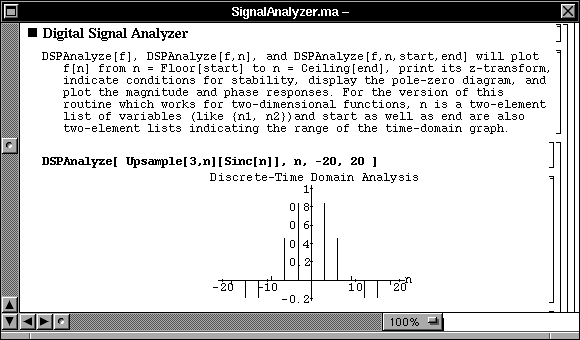
Labels:text | screenshot | display | number | font | software | line OCR: SignalAnalyzer.ma - X Digital Signal Analyzer DSPAnalyze [ f], DSPAnalyze [f, n], and DSPAnalyze [f, n, start, end] will plot f [n] from n = Floor [start] to n = Ceiling[end], print its z-transform, indicate conditions for stability, display the pole-zero diagram, and plot the magnitude and phase responses. For the version of this routine which works for two-dimensional functions, n is a two-element list of variables (like {n1, n2}) and start as well as end are also two-element lists indicating the range of the time-domain graph. DSPAnalyze[ Upsample [ 3,n] [ Sinc[n] ], n, - 20, 20 ] Discrete-Time Domain Analysis 1 0|8 0 6 04 0 2 -20 -10 10 201 -0. 2+ 100%