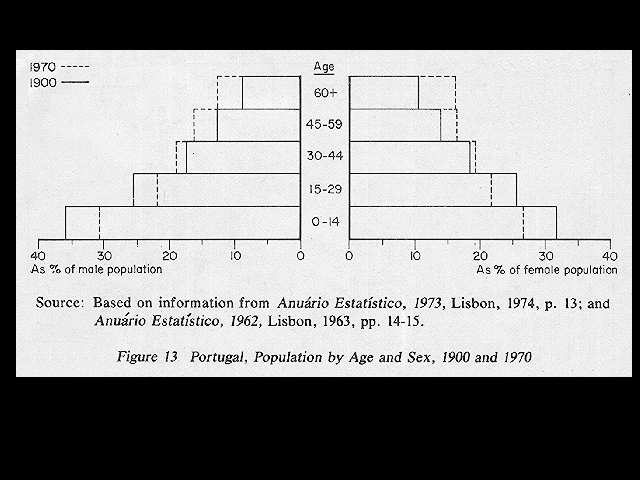
Labels:text | diagram | screenshot | rectangle | parallel | line | plan | technical drawing | number | black and white | schematic OCR: 1970 Age 1900 60+ 45-59 30-44 15-29 0-14 40 30 20 0 20 30 40 As % of male population As % of female population Source: Based on information from Anuario Estatístico, 1973, Lisbon, 1974, p. 13; and Anuario Estatistico, 1962, Lisbon, 1963, pp. 14-15. Figure 13 Portugal, Population by Age and Sex, 1900 and 1970