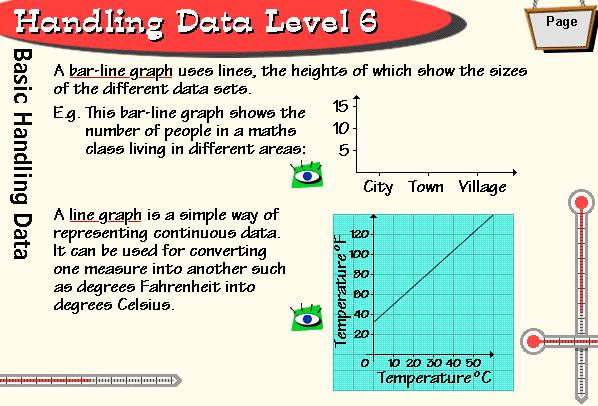
Labels:crt screen | dialog box | monitor | sky | streetlight | window | windowpane OCR: Hendlin Data Level Page A bar- line araph uses lines, the heights of show the sizes of the different data sets Tii bar-line graph shows the number of people in maths class living in different areas City Iown Village A line graph is simple way of representing continuous data 4 120 + can be used for converting as one dearees degrees measure Celsius into Fahrenheit another into such mperatunet 40 PO 20 30 140 50 Temperatureoc HanaIns which This Immm Temperaturenc