home
***
CD-ROM
|
disk
|
FTP
|
other
***
search
/
Cancer - Principles & Practice of Oncology
/
Oncology.iso
/
PPO
/
CHAP17
/
T4.GIF
< prev
next >
Tile
Graphics Interchange Format
|
1999-06-07
|
97.1 KB
|
703x357
|
8-bit (240 colors)
similar images
ocr:
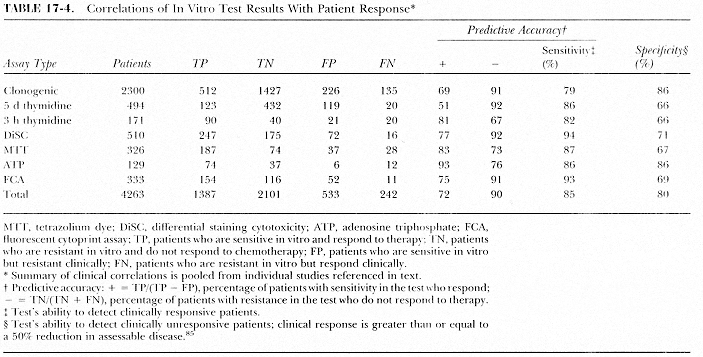
TABLE 17-4. Correlations of In Vitro Test Results With Patient Response* Predictive. Accuracyt Sensitivity: Specificitys Assay Type Patients TP TN FP FN + (%) (%) Clonogenic 2300 512 1427 226 135 69 91 79 86 5di thymidine 194 123 432 119 20 51 92 86 66 31 hi thymidine 171 90 40 21 20 81 67 82 66 DISC 510 247 175 72 16 77 92 94 71 MTT 326 187 74 37 28 83 73 87 67 ATP 129 74 37 6 12 93 76 86 86 FCA 333 154 116 52 II 75 91 93 69 Total 4263 1387 2101 533 242 72 90 85 80) MTT. tetrazolium dye; DISC. dlifferential staining cytotoxicity; ATP, adenosine triphosphate; FCA, Huorescent cytoprmt assay: TP ...