
Many developers don’t realize how little time it may take to achieve significant performance improvements in a Mac OS X application. So, to illustrate, consider this analogy:
Let’s suppose your relatives told you that they had left $5,000 in cash under the rug in a room in your house—what would you do? Do you leave the money there, knowing that you can get it if you ever need it; or do you pick up the rug, get the money, and spend it on something useful?
Like most of us, you probably chose the second option—you need all the money you can get.
As it is with money, so it is also with performance—and you can’t really afford to leave any performance "under the rug."
Apple provides an excellent, free performance tool called Shark that tells you—within two minutes—what functions you should concentrate your optimization efforts on. Experience working with developers indicates that most applications have performance problems that can be found in a few hours and fixed in a few days.
Two minutes to "pick up the rug," two hours to see how much "money" is there, and two days (or maybe a bit more) to put the "money" in your pocket—how can you ignore that?
Introducing Shark
Every copy of Mac OS X version 10.3 “Panther” includes the Xcode Tools CD. Xcode Tools is Apple’s development tools suite, which includes a set of performance/analysis tools by default. When you install Xcode, use the option to install the Computer Hardware Understanding Developer (CHUD) tool collection—click the Customize button during the Xcode install process and click the CHUD checkbox. Installing CHUD adds an additional set of low-level hardware-based performance analysis tools to your system and provides you with Shark, a tool for analyzing where a computer running Mac OS X spends its time in both application and system code.
NOTE: If you want to download the latest version of the CHUD Tools, you can do so from the: Developer FTP Site.
Shark is a valuable tool for even the most sophisticated optimization projects, but this article will show you how to use it to perform opportunistic optimization—that is, to find the few places in your code that are slowing your application down the most and that are relatively easy to fix. It will do this by walking you through the process of using Shark to optimize a public-domain GUI-based simulation called Noble Ape.
One important note: Since version 3.0, Shark has been able to read CodeWarrior symbol files; this means that if you use either Xcode or Metrowerks CodeWarrior to develop Mac OS X applications, you can use Shark.
Optimizing Noble Ape
The Noble Ape application simulates the thought processes of a troop of apes living on a tropical island. Because it includes a multi-window GUI interface, a non-polygonal graphics engine, and AI routines that simulate weather and thought processes, it is complex enough to be an appropriate candidate for demonstrating the benefits of opportunistic optimization.
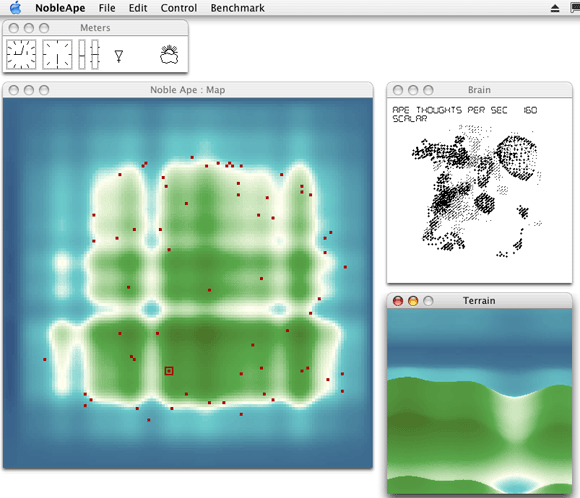
To demonstrate how modest optimization efforts can make a significant difference in an application’s performance, Apple engineers ported this program to Mac OS X, optimized it in several stages, and enhanced the application to enable the user to examine it at each of the stages of optimization.
Once you have installed the CHUD tools, you can find this enhanced version of Noble Ape on your hard disk at /Developer/Examples/CHUD/NobleApe. (You will first have to build the application. If you do so using Apple’s Xcode, you’ll find the completed application in the build folder.) Although the version of Noble Ape used to create this article is slightly different from the one that ships with Mac OS X, you can still use Shark with the shipping version of Noble Ape to perform the tests described in this article.
Estimating Performance Improvement
A good measure of the Noble Ape application’s performance is given by the number of "thoughts" it can simulate per second—the larger the number of simulated ape thoughts, the higher the application’s performance. You can see the current value of this variable by looking at the top of the application’s Brain window:
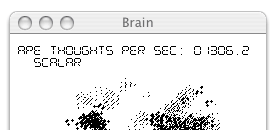
The screenshot above was taken while running the base version of Noble Ape on a Power Mac G5 with dual 2 GHz processors. After performing the optimizations described in the rest of this article (which, as it turns out, involves optimizing a single small region of code), the Brain window showed the following results:
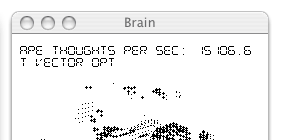
The "before" and "after" values of 1,306 and 15,106, respectively, indicate that optimizing a single region of code made the Noble Ape application over 11.5 times faster than the base version.
Most applications will see a more modest level of improvement. However, real-world data indicate that opportunistic optimization is worth the effort. For example, developers who have participated in the Apple-sponsored Performance Workshops often report performance increases of two or three times.
A Few Words About Opportunistic Optimization
Shark is very good at showing you places where your code can be optimized. However, only you can determine whether or not a given optimization actually improves your application’s performance. One good way to do this is as follows:
- Establish a baseline for measuring performance improvements (do this using a non-debug build that has debug symbols on).
- Use Shark to find a region of code that can be improved.
- Before you optimize this code, perform tests that give you solid data on some relevant aspect of your application’s performance. (Often, this involves bracketing the region being optimized with code that saves time-stamped messages to a log file.)
- Perform one possible optimization on this region of code, retest your code, and examine the "before" and "after" data you have gathered to determine how successful this optimization was.
NOTE: It is important that you implement and test only one optimization at a time.
- If you are considering more than one possible optimization, repeat step 3 for each alternate optimization.
- Examine the results of your optimization(s) and change the region of code in whatever way seems best to you. If you implement multiple optimizations, retest your code to ensure that you are getting the performance increase that you expect.
If you follow these steps to find and fix the top problem areas in your application, you will almost certainly be pleased by how much you have improved the performance of your application.
Another thing to keep in mind when analyzing code with Shark is that the reason behind a given region of code’s performance is not always obvious. Keep analyzing the code and its performance until you know why the code is performing the way it is.
In particular, if you find that your application is spending a lot of time in built-in operating-system or kernel code, don’t assume that system code is at fault and that there is nothing you can do to increase performance. Find out what role your code has in causing the system code to be executed. Doing so many uncover some optimization you can make that will improve your performance by reducing the time spent in system code.
Using Shark to Optimize Noble Ape
One good way to learn is by doing, so let’s assume that you have been given the task of taking a few days to improve the performance of the Noble Ape application. You begin by launching Shark, which is located on your main hard disk at /Developer/Applications/Performance Tools/CHUD:
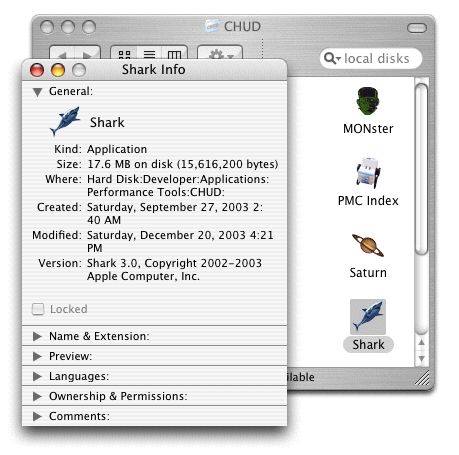
Here is what Shark looks like just after being launched:

Step 1: Analyzing the Unoptimized Application
Shark was designed to be useful with a minimum of work on your part. To analyze Noble Ape, shut down all open applications, then do the following:
- Launch the Noble Ape application.
- Launch Shark and click its Start button; after 30 seconds, Shark automatically stops analyzing. (If you wish, you can click the Stop button at any time.)
These operations cause Shark to examine what function the processor is executing at regular intervals (a process called sampling) and to display a table that lists each function along with the percentage of total time spent in that function (as approximated by the sampling process).
Less than two minutes have passed and, as promised, Shark returns with the data you need to start optimizing your application:
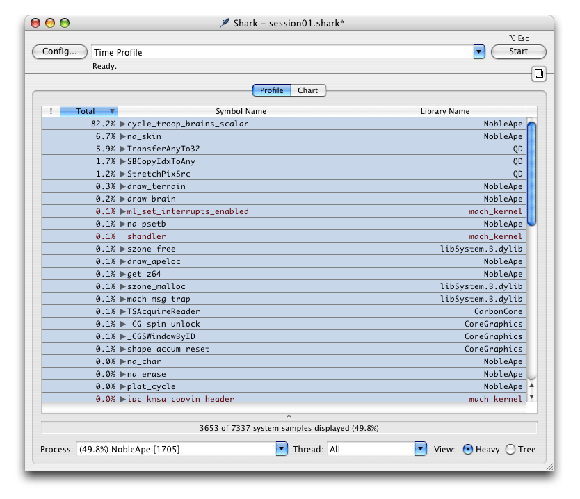
(Click the screenshot above to examine a full-size image of the Shark window.)
The screenshot below shows the top of this table, which is sorted by default to display the functions where your application spends most of its time.

This table displays, from left to right, the total time spent (expressed as a percentage), the function name (or, more accurately, the symbol name), and the name of the library to which the function belongs.
The Library Name column can be very useful in telling you where your application spends its time. Shark analyzes not just your own code but all the code that executes between the moment that you click the Start button and the moment that Shark ends its analysis. Lines listed in dark red represent supervisor code, which is usually Mac OS X kernel or driver code. In the screenshot above, various lines represent the application you are analyzing (NobleApe), Mac OS X operating-system code (QD), and supervisor code (mach_kernel).
Are the Processors Being Kept Busy?
Your first step is to determine whether your application is utilizing all the processor resources that are available to it. You can do that by checking the percentages in the Process pop-down menu at the bottom of the Shark window:

The fact that the mach_kernel process is consuming 47.4 percent of the processor resources means that the processors are spending almost half their time waiting for something to do.
One obvious way to get useful work out of unused processor resources is through the judicious addition of multiple threads of execution. Is Noble Ape multithreaded? Checking the Threads pop-down menu reveals that it is not:

As you can see by the percentage number, the only thread running is the Noble Ape application. So now you know that you want to add multithreading to this application. The next question is where?
Planning for Multithreading
Clicking the Tree radio button causes Shark to display its results in a hierarchical fashion that mirrors the overall structure of your application:
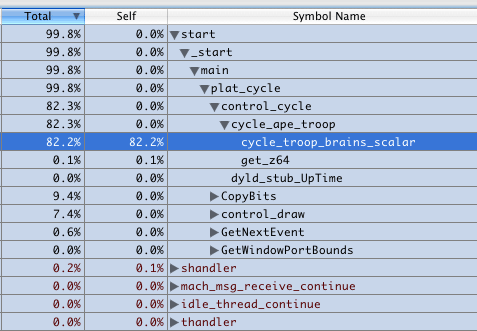
This view confirms what you suspected from the earlier view: namely, that the first function you should consider optimizing is cycle_troop_brains_scalar, the function that updates the state of all the apes’ brains.
After analyzing this function, you decide that you can move the actual brain calculations into two independent threads, which you separate from the application’s main thread. This threaded version of Noble Ape is potentially your first optimized version of the application.
If you were optimizing this application in a real-world context, you would make performance measurements on the base and threaded versions of Noble Ape and decide whether or not to keep the optimized version based on your results. Because you’re doing this optimization to learn about Shark, you simply note the "brain thoughts" number in the Brain window. The number for the threaded version is 2,355, indicating that this new version is 1.80 times faster than the original base application. Also, the Process pop-down menu indicates that the computer is now spending 82.8 percent of its time in threaded Noble Ape, an impressive improvement over the previous value of 49.8 percent.
You can confirm that the three threads are sharing the workload appropriately by examining the values in the Threads menu:

Because you’re sure that further optimization is possible, you decide to keep this first optimization.
Step 2: Optimizing the Threaded Noble Ape Application
You begin your second potential round of optimization by running Shark on the threaded version of Noble Ape. (On your computer, select "Threaded" on the Benchmark menu of Noble Ape to switch to the threaded version of the application.)
You find that the threaded Noble Ape process is still spending most of its time in the cycle_troop_brains_scalar, function, so you double-click on its entry in the table to reveal its source code:
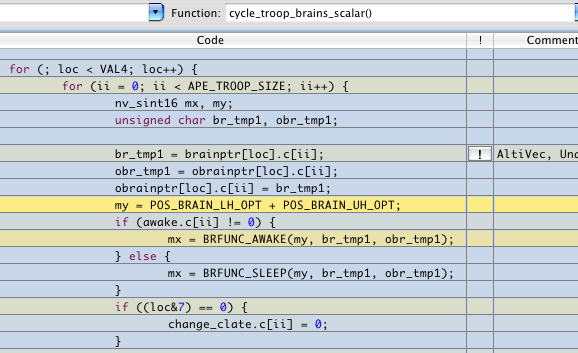
Using the Shark Code Browser
The Code Browser indicates what percentage of total time each line consumes in the Total column (not shown in the screenshot above). The most visible indication of time spent is the color of the line—the more yellow it is, the more time is being consumed on that line. In addition, thin horizontal yellow lines in the scroll bar (not shown in the screenshot above) mirror the position of the yellow lines of source code; this gives you a more global indication of where the computer is spending its time.
If you highlight a range of source-code lines, the status line at the bottom of the Shark window will tell you what percentage of total time is spent in the highlighted lines. When you highlight the double-nested loop enclosing the bright yellow line (the loop starts with the line beginning with for (; loc < VAL4; loc++) { ...), you discovered that this loop uses 93.3 percent of all processor resources. In other words, Noble Ape spends 93.3 percent of its time in this loop. Obviously, optimizing the code here will give you, more than anywhere else, the most improvement in overall application performance.
In addition to profiling your code, Shark also analyzes it and offers optimization advice. An entry in the "!" column of the table, when clicked, reveals a help window that suggests possible optimizations:
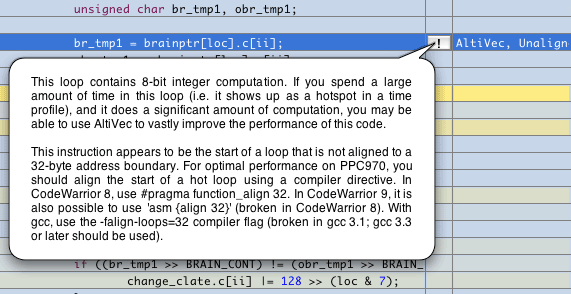
At this stage of the optimization process, you should ignore the advice in the second paragraph of the help window in the screenshot above; it offers advice regarding code optimization at the assembly-language level.
After analyzing the code loop, you decide to rewrite it using AltiVec vector arithmetic instructions; to avoid confusion, you rename the function containing this loop from cycle_troop_brains_scalar to cycle_troop_brains_vector. The resulting vectorized (and threaded) version of Noble Ape gives a "brain thoughts" number of 8,911, indicating that this new version is 3.81 times faster than the threaded one. (Remember that, in a real-world situation, you would use more rigorous performance measurements to evaluate this potential optimization for your application.)
In your judgment, this optimization is good enough to keep. You now have a vectorized version of Noble Ape, and your next step is to analyze this new version to look for further opportunistic optimizations.
Step 3: Optimizing the Vectorized Noble Ape Application
As before, you use Shark to analyze this new version of the application to see where it spends most of its time. The same function as before (this time, named cycle_troop_brains_vector) appears at the top of the table. You examine the source code of this function again and try several possible optimizations. The one you decide to keep uses AltiVec vector arithmetic instructions for the entire function (not just the double-nested loop) and rewrites the function’s logic to do its work in one loop instead of three separate loops performed in sequence. The resulting function, named cycle_troop_brains_vector_opt, gives a "brain thoughts" number of 15,106, indicating that this new "vectorized optimized" version is 1.69 times faster than the vectorized version.
Step 4: Optimizing the "Vectorized Optimized" Noble Ape Application?
Analyzing this "vectorized optimized" version of Noble Ape, you discover that the same function is still the one that is consuming most of the computer’s processing resources:

However, you are reasonably confident that there are no more opportunistic optimizations to be made on this function. Looking at the next function available for optimization, na_skin, you realize that even an extremely successful optimization to this function would probably make no discernible difference in the application’s performance. With that realization, you have proven to yourself that you are finished. You’ve made this application over 11 times faster—not bad for a few days of work!
More on Shark
There’s much more to Shark than this article has shown, including features that help you with:
- storing, retrieving, and comparing data from different sessions of code profiling
- multiple methods for triggering the sampling process
- visual displays of performance metrics at the source-code and assembly-code levels
- built-in tools that analyze your code and suggest improvements
- analysis of assembly code based on code alignment and dispatch groups
You can learn more about Shark by reading the Shark User Guide, located on your main hard disk at /Developer/Documentation/CHUD.
Opportunistic Optimization Is the Right Thing to Do
As stated at the beginning of this article, this final optimized version of the Noble Ape application is over 11.5 times faster than the original on a dual-processor 2 GHz Power Mac G5 computer. Granted, the same application will show less improvement on a single-processor Macintosh. But as time passes, it is likely that dual-processor Macintosh computers will become more commonplace, and applications that take advantage of the increased processing resources of such computers will have a significant advantage over those applications that don’t.
Though some of the optimization in Noble Ape depends upon running it on a dual-processor Power Mac, this doesn’t mean that you can afford to delay opportunistic optimizations until such computers become commonplace. Often, you will find that you can rewrite a critical region of code to be much faster or remove unnecessary code that slows your application down. Because it is quite possible to find such opportunities in your code today, this process of looking for opportunistic optimizations is something you should do now, not next year.
Launch your application, launch Shark, click its Start button—that’s all you have to do to get started. In two hours, you can determine whether there are opportunities for quick-but-significant improvements in your application’s performance. If there are—and there usually are—you can make a significant improvement to your application without investing a lot of time.
Opportunistic optimization delivers a big payoff with a little effort. It’s the right thing to do.
For More Information
Posted: 2004-01-19
|