
This article is about performance — how to think about it, how to measure it, and how to improve it. Of course, performance is a complex subject, and Apple has a Performance Page as well as a robust set of Performance Documentation available. This article supplements that documentation by giving you a framework for thinking about performance, as well as performance tips that you can use immediately.
Optimization: Theory
Maximizing your application’s performance is a two-step process. The first step involves ensuring that you are using the programming techniques most suited to Mac OS X architecture. The second step involves deciding what performance metrics are important and making sure your application meets those metrics. Apple provides a suite of versatile profiling applications and command-line tools to help you with this task.
Step One: Programming for Mac OS X
Mac OS X, with its virtual memory and preemptive multitasking, is structurally different from all previous versions of Mac OS. This means that certain programming practices that were effective in Mac OS 9 don’t work well under Mac OS X. The first step toward maximizing your application’s performance is to code (or, in the case of existing Carbon applications, recode) tasks in the way that is most efficient for Mac OS X.
Here are the most important Mac OS X-specific changes you should make your application. For details, see the Performance book.
- Eliminate polling. In Mac OS 9, it was acceptable to wait for certain events by executing an empty loop until the event occurred. In the multitasking Mac OS X environment, this is an unacceptable waste of time and resources. Instead, be event-driven and write routines that get called when the desired event triggers them. For Carbon applications, this means using the Carbon Event Manager.
- Reduce the working set. Mac OS X minimizes memory usage by pulling code from disk into memory as it is needed and discarding infrequently used code, as needed, to do so. At any moment, the number of pages of virtual memory that the application is using is called the working set. When you are close to finishing your application, you can use a manual code-reordering technique called scatter loading to minimize your application’s working set. See the “Improving Locality of Reference” section of the Performance book for details.
- Deliver a Mach-O binary. The Mach-O executable format replaces the lower-performing legacy PEF format commonly used in Mac OS 9. If your application runs under Mac OS X, you should deliver it using Mach-O.
- Prebind your application. When your application launches, Mac OS X must take time to “bind” undefined references in your code to the correct run-time locations. By prebinding your application during the build process, you can significantly decrease its launch time. For details, see the Apple Release Notes available on prebinding.
Step Two: Targeted Metrics And Optimization
The code changes you made in Step One are important, but this is where you’ll spend most of your time. Remember, you can’t improve performance until you first measure it, and you can’t know when you’re done until you have set a goal for your measurements.
Integrating Metrics into the Development Process
It is important that you make the process of measuring and improving application performance an integral part of your development cycle. Here is a four-step plan to help you get started:
First, decide which performance features are most important to you (see below for some suggestions).
Second, for each feature, choose an appropriate performance goal (for example, a launch time of under one second). You may want to evaluate competing products and match or exceed their performance.
Third, devise a procedure early in the development process for measuring each performance metric, using either custom code or an off-the-shelf tool.
Fourth, compare your application against each metric on a regular basis, and solve performance problems early. Some development teams establish a policy of refusing to accept any code that causes the application to miss its performance goals. Choosing your Metrics
You’ll get the best performance if you concentrate on the following metrics:
- minimizing launch time
- maximizing performance of drawing and live redraws (the drawing that occurs when the user is interactively resizing some visual element — the width of a table column or your application’s window, for example)
- maximizing performance of your application’s primary functions (that is, the operations that constitute the main work that your application performs for the user)
- minimizing your application’s use of system resources, including CPU usage, overall code size, and the size of your working set
A Methodology for Improving Performance
Once you’ve chosen your metrics and devised ways of measuring them, how do you go about improving your application’s performance? Many developers iterate a measure/analyze/recode loop until all their performance metrics meet the agreed-up on goal. “Measure” means using performance tools to gather data on how and where your application spends its time and system resources. “Analyze” refers to analyzing the data to find time and resource bottlenecks that cause the application to fall below metrics expectations. “Recode” involves devising an approach for reducing or eliminating these bottlenecks and then implementing that approach.
Applying this methodology throughout the development process reduces the amount of work you have to throw away.
Techniques for Improving Performance
Keep the following techniques in mind when you are devising solutions to your performance bottlenecks:
- Be lazy. Don’t allocate memory, run code, and otherwise consume resources until user actions require you to do so.
- Be frugal. Use the resources you need, but no more.
- Be resourceful. If an action takes too much time, find a way to do it quicker.
- Optimize for the average user. Don’t make 80 percent of your users suffer a performance penalty for features used only by the other 20 percent. Instead, write two versions of your code: a smaller, faster version that handles most users’ needs, and an alternate “heavyweight” version that is called only when needed.
- Wherever possible, cache and reuse instead of compute. This applies to read-only files, graphic images, often-performed calculations, dynamically-created menus, and other reused data.
Here’s an example of these techniques in action. When you’re trying to reduce your application’s launch time, look carefully at the contents of your main nib file. When your application launches, Mac OS X must load the main nib file before it can display anything on the screen. Loading a nib file can be very “expensive”; each object in the nib file must be instantiated and initialized, and the process may trigger the loading of a non-resident framework. If a resource is not needed to get your application to the point where it displays itself on the screen, you should move it to another nib file and load it after your application displays itself.
Optimization: Practice
The sections that follow give you “game plans” for five of the optimizations you are most likely to do.
Minimizing Application Launch Time
Metrics
Concentrate on minimizing the time interval from the moment you launch the application to the time at which your application finishes drawing all of its visible windows.
Tools
The sample command-line tool periodically takes a snapshot of the call stack and, at the end of the sampling period, displays the number of times that it found the application executing each of its functions. Use this tool to determine where your application is spending its time.
The fs_usage tool displays system-calling usage statistics related to file system activity. Examine the files and folders that are accessed for questionable accesses. Further investigation of these accesses may reveal high-level tasks that are executing too early or unnecessarily.
Techniques
In those cases where you need to know exactly how much time a certain routine takes to execute, you can use fs_usage to make this measurement accurately (although this requires you to modify your code slightly). Add code to your application that “touches” imaginary pathnames — for example, stat("START:draw main window") and stat("DONE:draw main window"). These attempts at I/O will appear, timestamped, in the output of fs_usage. You can easily search the output for these pathames, calculate the time the action took from the timestamps, and review all the I/O that the routine triggered. This is a general technique that is useful in many situations.
Game Plan
Search the data from sample for indications of where your application is spending its time during the launch process; look for functions that consume a lot of time. Similarly, search the data from fs_usage for functions and file accesses that you didn’t expect to see, and fix your code to eliminate unnecessary function calls and file accesses. Defer the execution of any code that is not absolutely necessary to the process of initially displaying your application’s windows to the user until after those windows have been made visible. Examine the code that is necessary to the launch process for opportunities to decrease code execution time.
Tips
While the sample tool may indicate a function that is taking a lot of time, that fact does not tell you whether the function is executing slowly or whether it is being executed a large number of times. Use the gdb debugger to find out how many times the function is being called.
Look for opportunities to cache and reuse data. For example, if you notice that your application scans in the contents of a given directory, determine whether the contents of the directory rarely change. If this is the case, rewrite your code to cache the directory’s contents along with a last-modification timestamp. Also, have your code check the directory’s modification timestamp and either use the cached data (if the directory hasn’t changed) or read the directory and rewrite the cache (if it has).
For Cocoa applications (and for Carbon applications that use nibs), make sure that your application’s main nib file contains only those resources needed to support the initial display of your application. Put everything else in other nib files.
If you’re writing a Cocoa application, put the code that is necessary for startup into the AwakeFromNib: routine. Put code that can be deferred until after startup into the ApplicationDidFinishLaunching: routine.
Optimizing Your Application’s Main Functions
Metrics
Here, you must decide which of your application’s main functions are the ones you are going to measure. For example, in a spreadsheet program, you might decide that spreadsheet recalculation time is an important metric. The time interval to measure is the interval from the end of the relevant user action to the moment when your application’s response is complete. Examine the performance of competing applications and set your goals appropriately.
Tools and Techniques
Use the sample and fs_usage tools, as described earlier, to measure how long to key functions take to execute and where the CPU is spending its time.
Game Plan
Search the data from sample and fs_usage, as described earlier, looking for functions that consume a lot of time, as well as for functions and file accesses that you didn’t expect to see. Fix your code to eliminate unnecessary function calls and file accesses. Examine the rest of your code for opportunities to decrease code execution time.
Tips
As with the previous section, look for opportunities to defer operations that are not absolutely necessary and to speed up operations by caching data.
Optimizing Memory Usage
Metrics
There are two metrics you should look at: your application’s memory usage just after startup is completed, and its memory usage over time during simulated normal usage. If it is a Cocoa application, you should also examine its patterns of object allocation over time.
Tools
The top command-line utility (see the screenshot below) displays a periodically updated table of the CPU and memory usage statistics for each process in the system. You’ll be interested primarily in the column labeled RPRVT, which stands for “process resident private memory” — that is, the amount of memory that each process is currently using.
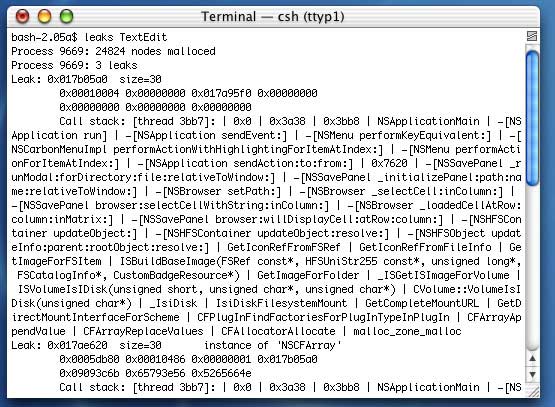
Use the leaks command-line tool (below) to find buffers that are allocated but not referenced by your program.
Use the MallocDebug application for analyzing how your application uses memory and for finding memory leaks.
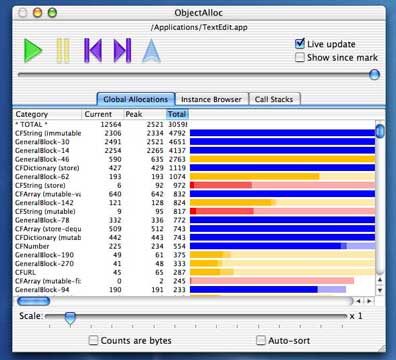
For Cocoa applications, you can use the ObjectAlloc application (see the screenshot at the beginning of this article) to track over time how the application’s objects are allocating memory.
Game Plan
Your first step should be to use the tools described above to detect and eliminate obvious memory leaks. Once you have done that, the task that remains — improving your application’s memory usage until it meets your metrics’ performance goals — is important, but it requires diligence and judgment to determine when you are finished.
Although you can easily obtain metrics (numbers) related to memory usage, it is harder to establish precise goals for these metrics. The best you can do is to do a “reality check” on how your application’s metrics compare to those of an application known to have good memory usage (the Mac OS X implementation of TextEdit is a good example). You should also analyze the numbers returned by the tools described above, searching for indications of possible problems.
The following example should give you an idea of how this approach works. Suppose you check the PRPVT value for TextEdit immediately after launch and find that it uses 700 KB of memory. You launch your application and compare its visual complexity to that of TextEdit. Suppose that your application uses, for example, 4 MB of memory. Obviously, you would expect your application, being visually more complex, to require more memory than TextEdit does. The question to ask yourself is whether or not the additional human-interface elements that your application initially displays can reasonably account for the extra 3.3 MB of memory being used. If you don’t believe that the extra memory usage is reasonable, you should analyze your application to determine what code is using the extra memory and whether or not the execution of that code can be deferred or eliminated.
Tips
Searching for potential memory problems and finding their causes are difficult tasks. You will need patience, discipline, and a good working knowledge of your tools and how to use them. As always, check the Performance book for information that can help you with this optimization task.
By observing the memory allocations that occur, you can infer which sections of your code are being executed. From this, you may discover opportunities to defer or eliminate the execution of some code. In particular, there may be alternatives to certain memory allocations that occur within loops, especially multiply-nested loops.
If you’re a optimizing a Cocoa application, watch for the effects of autoreleased objects, especially in multiply-nested loops. In certain situations, a large number of autoreleased objects may increase the size of the autorelease pool, which may cause significant memory use until the pool empties. You may be able to prevent such a situation by manually allocating and releasing certain objects at the right places.
Optimizing Drawing Operations
Metrics
Your application should draw static images as close to instantaneously as possible. It should also draw moving images frequently enough for movement to appear smooth and flicker-free. You can tell where you have problems by watching for noticeable drawing delays during normal use of your application.
Tools
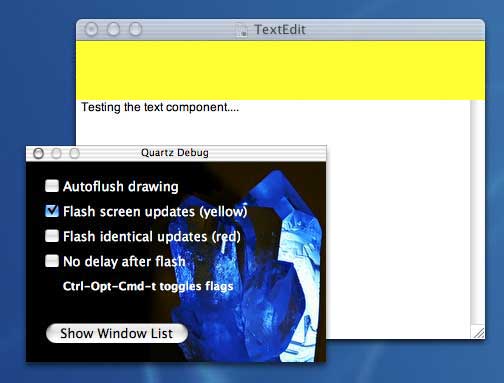
As described earlier, you can use fs_usage and timestamping to measure the length of drawing operations. You can also use the QuartzDebug application (see below) to highlight the regions of the screen that are about to be updated.
Game Plan
First, execute your program along with QuartzDebug and analyze the region updates for situations that indicate that your drawing code is not as efficient as it could be. In particular, watch for regions that are updated multiple times, regions that are updated even when their content remains unchanged, and regions that are updated when only a smaller section of the region actually changes.
Next, examine the speed of your application’s drawing operations during normal use, as described in the Metrics section, above. Use the sample and fs_usage tools to search for clues that indicate code that can be eliminated or deferred.
The responsiveness of your application during live resize operations (interactive resizing of windows or table column widths, for example) is always important. If such operations are too sluggish, consider various ways of simplifying the redraw process to make the live resizing more responsive.
Tips
When your Cocoa application frequently redraws two small regions diagonally oriented toward each other, the Cocoa view system may instruct your application to redraw a single, large rectangle that encloses both small regions instead of redrawing the two small regions. When this occurs, you may be able to improve your application’s performance by forcing it to redraw the two small regions. The way to do this varies according to the situation. One thing you can try is changing how often each small regions gets redrawn (for example, by alternating which region redraws during successive drawing cycles).
Instead of redrawing a given region every time, you may want to check it to see if it has changed and the redraw it only when necessary.
Do not waste CPU resources by redrawing an image more often than is needed. A refresh rate of 20 times per second is usually sufficient, and you may find even lower refresh rates acceptable.
If you have optimized your application as much as you can and still are not meeting your performance goals, you can try various performance tricks to make your drawing more responsive. All such tricks involve simplifying the drawing process in ways that the user does not notice, or notices but still finds acceptable. For example, when necessary, you may redraw your window less frequently. In the case of the live resizing of your application’s window, you may decide that it is acceptable to not redraw the window contents while the user is dragging the grow box, but rather display a cached image during the drag operation and redraw the window contents only when the user releases the mouse button.
Optimizing Text Drawing Operations
Metrics
The metric to be minimized is the time taken to draw text. This number should be minimized as part of the responsiveness and drawing optimization steps.
Tools
Use the fs_usage and sample tools to measure text-drawing times.
Game Plan
Use the data produced by fs_usage and sample to search for opportunities to maximize performance. In addition to the usual optimizations, check to ensure that you are using the simplest (and therefore fastest) text-drawing functions that accomplish the desired objective; see the next section for details.
Tips
To prepare your application for global markets, you should be using Unicode for all text storage and manipulation. However, be aware that the Apple-supplied Unicode text-manipulation APIs have different performance characteristics from Apple’s legacy ASCII text-manipulation APIs, and that you need to be aware of these differences to maximize your application’s text-drawing performance. For example, text-layout operations are “expensive,” with the consequence that you should use layout and style objects wisely. In particular, you can reuse a single layout object for multiple paragraphs simply by changing the text it points to. Where appropriate, you can cache and reuse style objects instead of recreating them. Also, when you need to measure the width of the text string, in most cases you can use the ATSUGetGlyphBounds routine rather than the more elaborate (and expensive) ATSUMeasureText and ATSUGetUnjustifiedBounds routines.
|