Debugging Extensions
You test and debug extensions using Safari’s built-in developer tools: the Web Inspector, Error Console, and integrated JavaScript debugger. Learn how to use these tools by reading Safari User Guide for Web Developers.
This chapter shows you how to apply the developer tools specifically to Safari extensions, but does not go into detail about using the tools.
Debugging Extension Bars
To debug an extension bar, control-click or right-click on the extension bar. This brings up a contextual menu with two choices: Reload and Inspect Element. To debug, choose Inspect Element.
This opens the Web Inspector with the extension bar selected and opens a copy of the Error Console dedicated to the extension bar. This is illustrated in Figure 14-1.
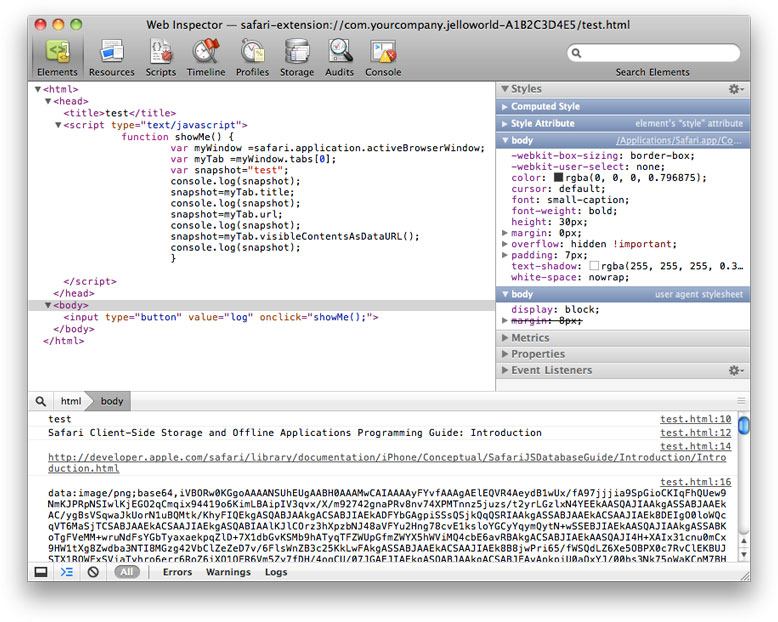
The Elements pane shows the DOM tree for the extension bar, including any in-line JavaScript. HTML or JavaScript syntax errors are numbered and highlighted in red.
Clicking an element highlights it in the extension bar of the browser window, displays its atributes and styles, and allows you to edit them interactively (double-click an attribute or style value to edit it). You can display event listeners for all nodes, or any given node.
In addition, the console API is supported for extension bars and is compatible with Firebug. You can log data to the console and see it using the Web Inspector. In the example shown, the extension bar logs the word “test”, followed by the title and URL of the current tab, then an image of the visible portion of the window as a base-64 encoded PNG.
If your extension bar includes any .js files or other resources, you can inspect them by clicking Resources. You can enable JavaScript debugging, set breakpoints, profile your JavaScript, look at how resources load, or examine HTML5 local storage databases, just as you would on a website you were developing. For details, see Safari User Guide for Web Developers.
Debugging Injected Scripts
Debugging an injected script or stylesheet with the Safari developer tools is very much like debugging a script or stylesheet for your own website. The main difference is that you must load a webpage that your extension has access to in order to inject the script for debugging.
Choose Show Web Inspector from the Develop menu or right-click on the webpage and choose Inspect Element, then click Scripts and choose your script from the pop-up menu of script names. Your script name is prefaced by safari-extension://, as illustrated in Figure 14-2.
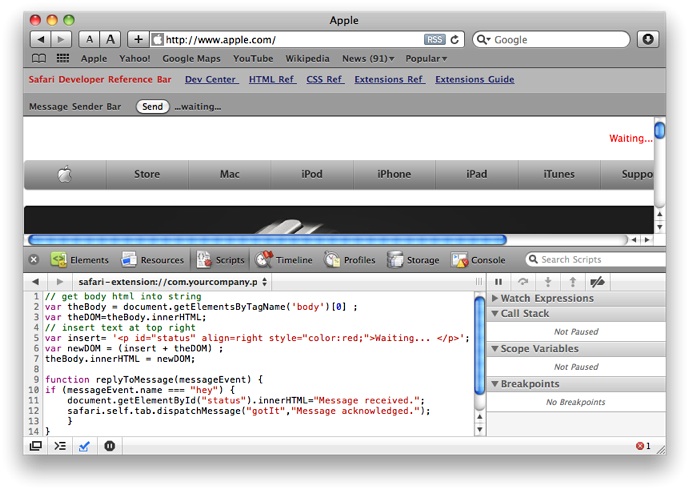
Any detected errors in the script are shown in the Error Console. Click in the gutter between the line number and script to set a breakpoint. The firebug-compatible console API is available for logging data.
Note: Currently, you cannot use the console to interactively enter the names of injected script objects, such as variables or functions defined in the script. You can log data to the console using the console API, set breakpoints, profile scripts, and so on, but the private namespace of your injected script keeps the console from recognizing object names defined in the script.
For more information on debugging scripts, see Safari User Guide for Web Developers.
Debugging a Global HTML Page
When your extension has a global HTML page, a button is added to the Extension Builder interface, below the Global Page File field, as illustrated in Figure 14-3.

Click Inspect Global Page to open the Web Inspector with your global page selected for debugging.
For details on debugging HTML and JavaScript using Safari’s integrated tools, see Safari User Guide for Web Developers.
Last updated: 2010-08-03