Doing an Initial Performance Evaluation
So, you have some code and you want to see if it is suffering from performance problems. Where do you start? Not all problems are immediately visible. You might notice that an operation took several seconds to perform, but you might not notice an operation that consumed too many CPU cycles or allocated too much memory. This is where Apple’s performance tools come into play. They can help you see aspects of your program that are easily overlooked.
The following sections provide a brief overview of how to use some key tools when starting to analyze your program. These tools are good for identifying potential problems and can provide a significant amount of performance data. Remember, though, that there may be other tools that provide more specific information related to the problem. Running your application with several other tools can help you confirm whether a particular area is a problem.
Important: The performance tools are there to assist you in investigating performance problems. Make sure you gather as much data as you can during your analysis. Performance analysis is somewhat of an art and requires careful consideration of all available data to find the real problem.
For more information about the performance tools in general, including where to get them, see “Performance Tools.”
Using top
The top tool is an important tool for identifying potential problem areas in a process. This tool displays a periodically sampled set of statistics on system usage. Using top and understanding its output are an excellent way to identify potential performance problems.
The top tool displays periodically updated statistics on CPU usage, memory usage (in various categories), resource usage (such as threads and ports), and paging events. In the default mode, top displays CPU and memory utilization of all system processes. You can use this information to see how much memory your program is using and what percentage of the CPU time it is using. An idle program should not use any CPU time and an active one should consume a proportionate amount of CPU time based on the complexity of the task.
Note: If you want to track CPU usage and other statistics over time, use BigTop instead. BigTop graphs performance trends over time, providing a real-time display of memory usage, page faults, CPU usage, and other data.
Listing 4-1 shows a typical statistical output from top. For application developers, the statistics you should be most interested in are the CPU usage, resident private memory usage (RPRVT), and pagein/pageout rates. These values tell you some key things about your application’s resource usage. High CPU usage may mean that your application’s tasks are not tuned appropriately. Increased memory usage and page-in/page-out rates may indicate a need to reduce your application’s memory footprint.
Listing 4-1 Typical output of top
Processes: 36 total, 2 running, 34 sleeping... 81 threads |
Load Avg: 0.24, 0.27, 0.23 CPU usage: 12.5% user, 87.5% sys, 0.0% idle |
SharedLibs: num = 77, resident = 10.6M code, 1.11M data, 4.75M LinkEdit |
MemRegions: num = 1207, resident = 16.4M + 4.94M private, 22.2M shared |
PhysMem: 16.0M wired, 25.8M active, 48.9M inactive, 90.7M used, 37.2M free |
VM: 476M + 39.8M 6494(6494) pageins, 0(0) pageouts |
PID COMMAND %CPU TIME #TH #PRTS #MREGS RPRVT RSHRD RSIZE VSIZE |
318 top 0.0% 0:00.36 1 23 13 172K 232K 380K 1.31M |
316 zsh 0.0% 0:00.08 1 18 12 168K 516K 628K 1.67M |
315 Terminal 0.0% 0:02.25 4 112 50 1.32M 3.55M 4.88M 31.7M |
314 CPU Monito 0.0% 0:02.08 1 63 35 896K 1.34M 2.14M 27.9M |
313 Clock 0.0% 0:01.51 1 57 38 1.02M 2.01M 2.69M 29.0M |
312 Dock 0.0% 0:03.72 2 77 78 2.18M 2.28M 3.64M 30.0M |
311 Finder 0.0% 0:07.68 4 86 171 7.96M 9.15M 15.1M 52.1M |
308 pbs 0.0% 0:01.37 4 76 40 928K 684K 1.77M 15.4M |
285 loginwindow 0.0% 0:07.19 2 70 58 1.64M 1.93M 3.45M 29.6M |
282 cron 0.0% 0:00.00 1 11 14 88K 228K 116K 1.50M |
245 sshd 0.0% 0:02.48 1 10 15 176K 312K 356K 1.41M |
222 SecuritySe 0.0% 0:00.14 2 21 24 476K 828K 1.29M 3.95M |
209 automount 0.0% 0:00.03 2 13 20 336K 748K 324K 4.36M |
200 nfsiod 0.0% 0:00.00 1 10 12 4K 224K 52K 1.22M |
199 nfsiod 0.0% 0:00.00 1 10 12 4K 224K 52K 1.2 |
[...] |
In its header area, top displays statistics on the global state of the system. This information includes load averages; total process and thread counts; and total memory, broken down into various categories such as private, shared, wired, and free. It also includes global information concerning the system frameworks. At regular intervals, top updates these statistics to account for recent system activity.
Table 4-1 describes the columnar data that appears in the CPU and memory utilization mode using the -w parameter. For detailed information about how top reports information, see the top man page.
The RPRVT data (for resident private pages) is a good measure of how much real memory an application is using. The RSHRD column (for resident shared pages) shows the resident pages of all the shared mapped files or memory objects that are shared with other processes.
Note: The top tool does not provide a separate count of the number of pages in shared libraries that are mapped into the process.
The top tool reports memory usage of windows in the “shared memory” category because window buffers are shared with the window server.
Table 4-2 shows the columns displayed in the event-counting mode, which is enabled with either the -e, -d, or -a option on the command line. You can use these options to gain additional insight about specific behaviors of your application. For example, you can correlate the number of page faults with the amount of memory your application is using to determine if your application’s memory footprint might be too big.
Using Instruments
Instruments is an incredibly powerful tool that you can use to gather performance data and analyze your application’s overall behavior. The Instruments application supports applications running in either Mac OS X or iOS. When in doubt, you should start your performance analysis using Instruments because it is simple to use and gives you a wide variety of options for gathering data. One of the more useful features of the Instruments application is the ability to see different types of performance information graphed side by side. Seeing information in this way makes it easier to identify trends and relationships between seemingly different metrics.
When you first launch Instruments, you are asked to select a starting template for your document (Figure 4-1). The templates come preconfigured with one or more instruments that are designed to gather data for specific situations. For example, the Leaks template includes both the ObjectAlloc instrument and the Leaks instrument, letting you see both the total number of memory blocks that were allocated and the subset of those memory blocks that are considered leaks. You can add more instruments to a document at any time but the common configurations provided by the templates are usually sufficient for typical tasks.
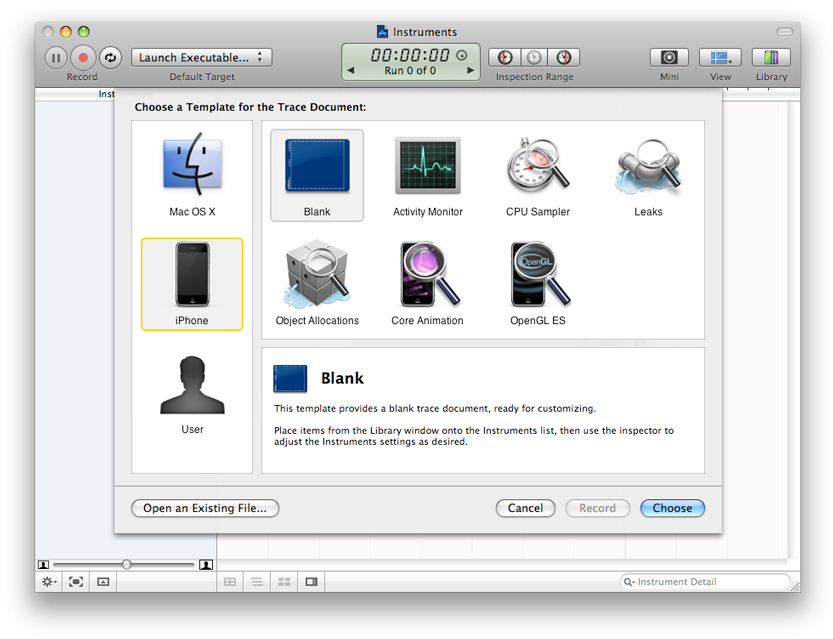
When creating a document, you can also choose to gather data for an application running in either Mac OS X or iOS. Choosing a particular platform configures the document for that platform by default, but you can change the platform later if needed.
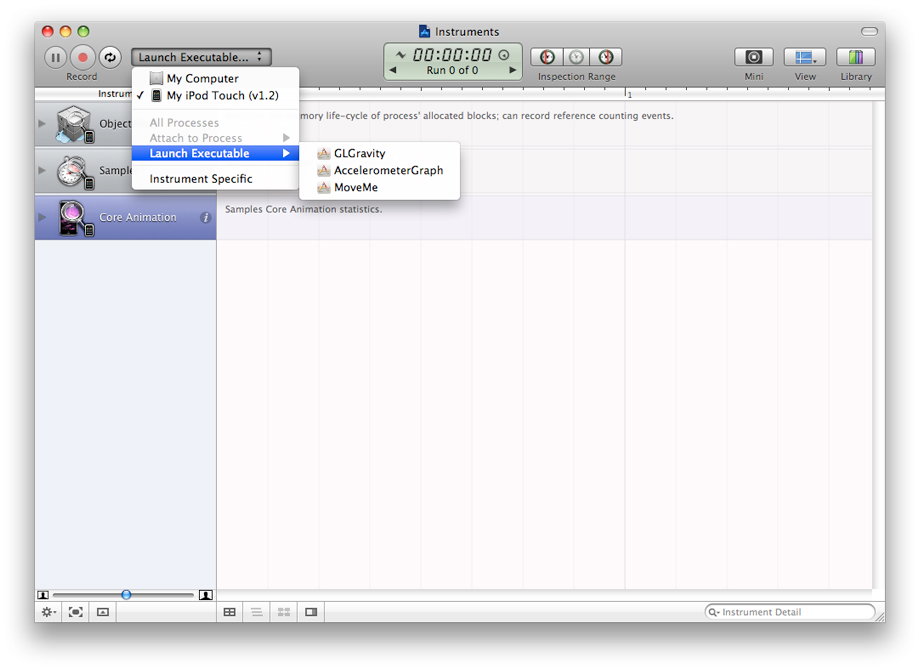
After you create your document, you must select which application (or applications) you want Instruments to monitor. You do this using the Default Target control in the document’s toolbar. Figure 4-2 shows an instruments document being configured to launch and monitor an application on an iOS-based device. When tracing iPhone applications, you launch the executable as part of the overall tracing process. For Mac OS X–based applications, some instruments give you the option of attaching to an already running process.
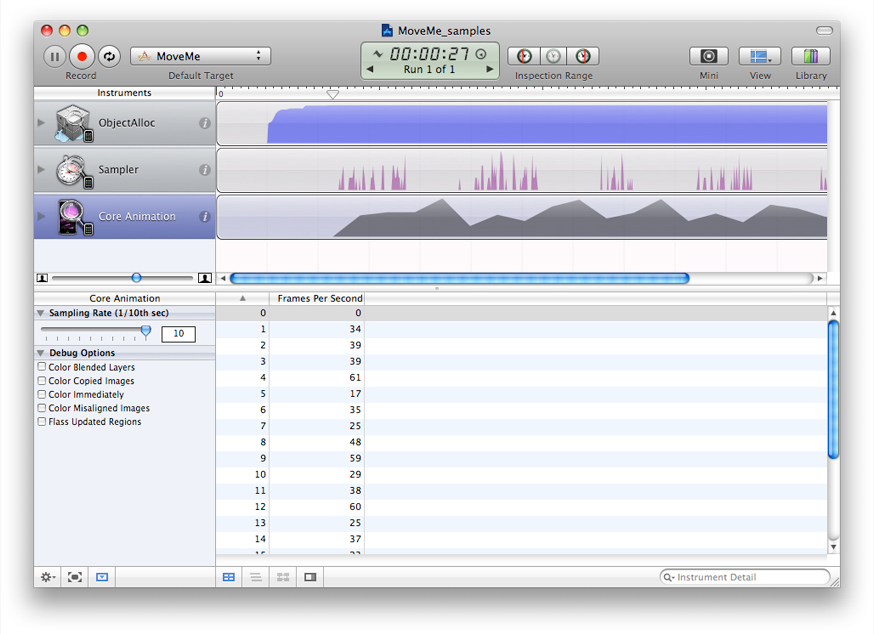
After selecting the process you want to monitor, you click the Record button and Instruments starts recording data for the selected application. Data recording takes place in real time, so you can interact with your application and initiate any tasks you want to check for performance problems. As you manipulate your application, Instruments shows the resulting data in the trace document window. To stop recording, press the Record button again, which should now be titled Stop.
Figure 4-3 shows the data gathered for the MoveMe sample application after a recording run. The graphical view for most instruments is configurable so that you can look at the data that is most interesting to you. In the figure, the ObjectAlloc instrument shows the total amount of allocated memory, but you can also change the display to show the density of memory allocations at any given time. Below the graphical view, you can view the detailed data that was gathered by Instruments from the running application.
For detailed information about how to use Instruments and for information about the types of performance data you can gather, see Instruments User Guide.
Using Shark
Shark is one of the most powerful analysis tools you can use to find performance problems in your code. Shark can generate a time-based profile of your program’s execution, trace function calls, and graph memory allocations over time. You can use Shark to track information for your program or for the entire system. Shark even captures execution information for kernel entities such as drivers and kernel extensions.
Despite the power of Shark, using the tool is very simple. Upon launch, Shark presents you with the window shown in Figure 4-4. Click Start (or use the Option-Escape global shortcut) to start sampling all system processes. Click the button again (or use the same global shortcut) to stop gathering data and display the samples (Figure 4-5).
If you want to limit sampling to only one process, you can use the pop-up menu on the right side of the window to select that process. Also, if you want to do something other than a statistical time profile, choose the appropriate option from the configuration pop-up menu before you click Start.
When you stop sampling, Shark displays the profile window (Figure 4-5) with the gathered data. This is the main window you use to identify potential problems. You can configure this window to display a heavy view, tree view, or both.
The heavy view sorts function calls based on the frequency by which they appeared. This view identifies your program’s hot spots. If you see one of your program’s functions near the top of this view, you should investigate it. Functions tend to have higher weights if they are poorly optimized but a more likely scenario is that the function is being called too frequently from some other place. This can indicate an inefficient higher-level algorithm.
The tree view shows the same data organized by calling hierarchy. This view offers a convenient way to understand the context in which a particular function is called. This is the more traditional way to view call stack data and can be used in conjunction with the heavy view to track down hot spots and to see the surrounding context quickly.
The Shark profile window makes it easy to filter out irrelevant code and libraries through a feature called data mining. The Data Mining menu has several options for excluding or flattening symbols and libraries. If you apply these commands, Shark rolls the costs of calling those symbols and libraries into the function that called them. For example, if you know your code makes several calls to Core Foundation and you exclude the Core Foundation library, the time spent in Core Foundation now appears as time spent in your code. If the amount of time spent in your code jumps significantly afterward, you might want to investigate ways to call fewer Core Foundation functions.
Shark also can help you identify performance issues within a given function through the code view. When you double-click a function, Shark displays the source code for that function if it is available (see Figure 4-6). It applies color to lines of code based on the amount of time spent in that code. For each line of source, brighter shades of yellow indicate where more time was spent during the profile.
Shark occasionally offers specific tuning tips and comments in the margin. Clicking the exclamation-point icon displays a tip that you can use to improve your code. The comment column displays a summary of the tip.
For more information about Shark and its features, see Shark User Guide.
Using Quartz Debug
Quartz Debug is an important tool for determining the efficiency of your drawing code. The tool collects information from your program’s drawing calls to find out where your program is drawing and whether it is redrawing content unnecessarily. Figure 4-7 shows the Quartz Debug options window.
With the Flash screen updates option enabled, Quartz Debug shows you visually where your code is drawing. It places a yellow rectangle over an area where a redraw operation is about to occur and then pauses briefly before redrawing the content. This flickering yellow pattern can point out places where you are drawing more than is necessary. For example, if you update only a small portion of a custom view, you probably do not want to be forced to redraw the entire view. Alternatively, if you see a system control being redrawn several times in succession, it might point out the need to hide that control before changing its attributes.
The “Flash identical updates” option displays red over any areas whose resulting bits are identical to the current content. You can use this option to detect redundant drawing operations in your code.
Using Spin Control
If an application becomes unresponsive at any time, the window server notifies the user of this situation by changing the cursor to a spinning multi-color wheel. If your application is the one that is unresponsive, sampling it during that time can help you determine why it is unresponsive. However, even if you have Instruments or another tool ready to go, you might not be able start them fast enough to gather a set of samples during the unresponsive period. This is where Spin Control provides a helpful solution.
Spin Control is a monitoring tool that automatically samples while they are unresponsive. Simply launch Spin Control and leave it running on your computer whenever you are testing your application. When the spinning cursor appears, Spin Control automatically starts sampling your application, making the results available from its main window, as shown in Figure 4-8.
To view the backtrace for a particular session, select that session and click Open. Spin Control displays a browser window containing the sample data, as shown in Figure 4-9. You can navigate the call stacks for your threads and use the data to find out which function or methods were executing while your application was unresponsive. The controls in the bottom-left corner of the window let you invert the call stack information and change the way you view the samples. The buttons at the bottom right let you prune the call stacks and focus on the most relevant entries.
If you want to view a complete listing of the call stacks, click the “Show text report” button on the main window. This format shows a formatted version of the entire data set that you can copy and paste into other documents.
Last updated: 2010-05-14