 Developer Magic ProDev WorkShopDeveloper Magic ProDev WorkShop
![]()
Today's developers are pushing the limits of technology by designing increasingly complex and sophisticated systems. Applications now take advantage of many languages, multiple processors, increased processor speed, 3-D graphics and multimedia. Based on a powerful object oriented architecture, WorkShop is built from the ground up, providing unparalleled levels of integration and functionality.Whether you're programming in C, C++, Fortran, or Ada95, for single-processor workstations or multi-processor servers, ProDev WorkShop has a complete set of tools.
ProDev WorkShop is an advanced environment, offering an integrated set of powerful and highly visual tools, including:
The Static Analyzer is a visual source code navigation and analysis tool. It operates in two modes:
With the Static Analyzer, users can visualize the structure of their programs and easily navigate through their code, which is vital for restructuring and re-engineering existing software. The graphical presentation makes the structure of the code very easy to understand, even for someone who is not the original developer. It is also helpful in porting situations when code that is being ported to other platforms will not run or compile.
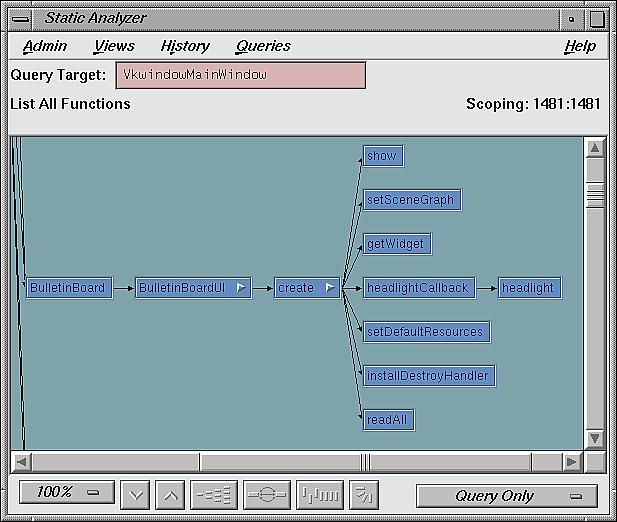
The Static Analyzer provides a variety of different views:
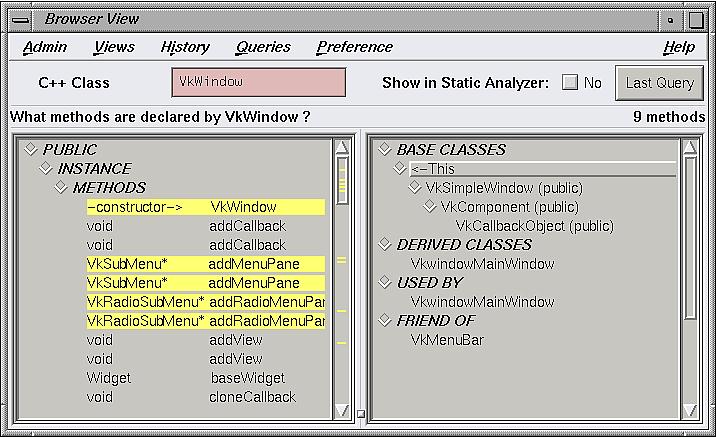
The browser provides a set of static analysis queries tailored for C++ programs. These queries help users analyze interdependencies of a class with its related classes such as base classes, derived classes, component/container classes, classes that are used, and friend classes. A few examples of queries on class members and related classes:
The Class Browser handles extremely large programs, and provides easy navigation even when analyzing complex problems. Users can control the amount of information to be viewed when analyzing class relationship graphs or viewing class definitions. For example, the user can choose to display all class relationships or just immediate class relationships with respect to a class. Similarly, when viewing a class definition, users can choose to view just its public members.
The various views are integrated, providing the ability to select a class or method in one view and display additional information about it in another view. The Class Information Window can be invoked by clicking on a class in the Class Graph, and the Call Graph can be pruned or populated from the Class Information Window. Also, Source View, the annotated textual viewer used by all WorkShop tools, can be invoked by clicking on a class in any of the views.
The WorkShop Debugger is a state-of-the-art source-level debugger featuring multiple graphical views that are dynamically updated during a program execution. It was written from the ground up by Silicon Graphics developers to provide functionality unavailable in standard UNIX debuggers. It is tightly integrated with the other tools, particularly the Performance Analyzer, providing increased efficiency for overall program analysis.
 In large-scale development efforts, the Debugger provides unparalleled
support for large programs. Other debuggers that provide such high levels
of functionality often cannot handle programs over 50,000 lines of code.
Not only can the Debugger handle millions of lines of source and executables
over 100MB, it facilitates the debugging effort by providing different views
into the code, which allows for better understanding of large amounts of
data.
In large-scale development efforts, the Debugger provides unparalleled
support for large programs. Other debuggers that provide such high levels
of functionality often cannot handle programs over 50,000 lines of code.
Not only can the Debugger handle millions of lines of source and executables
over 100MB, it facilitates the debugging effort by providing different views
into the code, which allows for better understanding of large amounts of
data.
Fix & Continue gives you the ability to make changes to a program you are debugging without having to recompile and link the entire program. You can edit a function, parse the changes, and continue execution. Fix & Continue significantly speeds up the development cycle.
Fix & Continue lets you:
Tools such as the 3-D Array Visualizer and the Structure Browser allow users to identify problems in their code by examining the visual representation of the expressions or data. The Debugger provides 15 different "views" into a program that are dynamically updated as the user steps through the program.
Most debuggers that support watchpoints do so by single-stepping the target process, thereby slowing the program down by several orders of magnitude. The WorkShop debugger, with support from the IRIX(tm) operating system, implements fast data watchpoints that permit better performance of the target process than traditional implementations.
The WorkShop debugger allows programmers to evaluate FORTRAN, C and C++ expressions in their native syntax. The Debugger has extensive support for C++ expressions such as static and non-static data members, virtual functions, multiple inheritance and virtual base classes.
MP View provides debugging support for programs that have multiple processes or have been parallelized. It permits automatic or manual specification of process groups, and provides individual and group process control. Traps can be set to stop a single thread or all threads. The Debugger is based on a client/server model, allowing distributed debugging.
Three views provide powerful machine-level debugging capabilities: Register View, Memory View and Disassembly View. Each view allows the modification of the values it displays. The Disassembly View allows disassembly of the displayed code by address, function or file.
Efficient access to most dbx commands is provided for those who prefer a command line interface.
A wide variety of performance experiments help you identify bottlenecks, pinpoint system resource usage, and detect memory leaks. Graphical views clearly depict which resources are being under- or over-utilized. Time calipers let you zoom in on specific sections of code for detailed tuning.
The Build Manager lets you recompile from within the ProDev WorkShop environment, and graphically displays makefile dependencies and compiler messages.
The ProDev WorkShop test coverage analysis tool spots potential problem areas by identifying sections of code that are not covered in tests.
Success Stories:
COPYRIGHT © 1996 Silicon Graphics, Inc. All Rights Reserved.