Features
Intelligent Error Interception
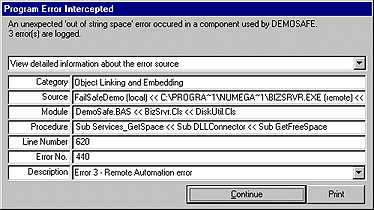
Stop your programs from crashing without writing a single line of code. FailSafe stabilizes your project and stops crashes by intercepting errors and coding them by type, class, number, and description.
FailSafe identifies both the location where the error originates and where it was trapped by module, routine, and line number. Use the call-tree to display the routines that lead to an error, complete with arguments and values. This valuable information provides the context surrounding the error. Over 75 data points cover the system configuration and help to isolate platform-related errors.
FailSafe can write error information to a log file for future debugging. If your PC is connected to a network, FailSafe can even e-mail the log file to a predetermined address automatically.

Sophisticated and Powerful Procedure Tracing
View procedures as they execute and examine all arguments and values, even after compiling. FailSafe traces multiple, simultaneous programs; allowing you to view complex client-server interactions and program-to-program interactions. This is extremely important useful for DDE, OLE server and OLE automation development.
FailSafe isolates event-driven errors, client-server errors, and errors with compiled executable programs that the Visual Basic built-in step-trace cannot find. FailSafe pauses and step-traces applications, compiled or not, allowing you to step through programs call by call.
Integrated Debugging and Performance Analysis
With FailSafe, you can analyze your project, find performance bottlenecks, and nail errors to the line number within minutes. FailSafe automatically pinpoints these and other hard-to-find problems:
- Event-driven errors not detected by the Visual Basic built-in debugger
- Symbol table exhaustion
- Resource leakage
- Errors caused by bad values passed to calls
- Uncontrolled recursion
- Event cascades
- Windows API errors
- Invalid DLLs and VBXs
Customizable Error Handling
Using templates, you can customize FailSafe error handling to suit your own needs. FailSafe provides templates for maximum or minimum instrumentation with error code, trace code or both. Use one of the templates that comes with FailSafe or create your own.
The Professional Advantage
FailSafe Professional Edition adds powerful profiling and over 20 OCXs, VBXs, ActiceX, and utilities (16-bit and 32-bit).
Advanced Performance Profiling
FailSafe analyzes and profiles your programs, monitors memory usage, shows resource hogs, and highlights the routines that need to be optimized for peak performance. In seconds, FailSafe:
- Highlights performance bottlenecks
- Spies inside your program as it runs, even when compiled
- Monitors memory and system resources routine-by-routine
- Times procedures with ultra-high resolution
- Shows procedures statistically in a spreadsheet and in a graph
- Shows you project's procedures, arguments, and their values
- Step-traces compiled programs to find errors that crash EXEs
With FailSafe Professional Edition, You Can:
- Create your own custom debugging applications
- Add non-Visual Basic events to trace files and program logs
- Monitor and display Windows API call errors, failures and codes
- Over 20 custom control ActiveX (OCXs), VBXs and ultilities
- View Active X (OCX), VBX, DLL, EXEs and threads starting and stopping
|
![[Pin]](/file/33664/PCPLUS131.iso/COMPONEN/FAILSAFE/DEMO/IMG/FRA.GIF)
![[Pin]](/file/33664/PCPLUS131.iso/COMPONEN/FAILSAFE/DEMO/IMG/GER.GIF)
![[Pin]](/file/33664/PCPLUS131.iso/COMPONEN/FAILSAFE/DEMO/IMG/ITA.GIF)
![[Pin]](/file/33664/PCPLUS131.iso/COMPONEN/FAILSAFE/DEMO/IMG/SWE.GIF)
![[Pin]](/file/33664/PCPLUS131.iso/COMPONEN/FAILSAFE/DEMO/IMG/NETH.GIF)
![[Pin]](/file/33664/PCPLUS131.iso/COMPONEN/FAILSAFE/DEMO/IMG/GB.GIF)