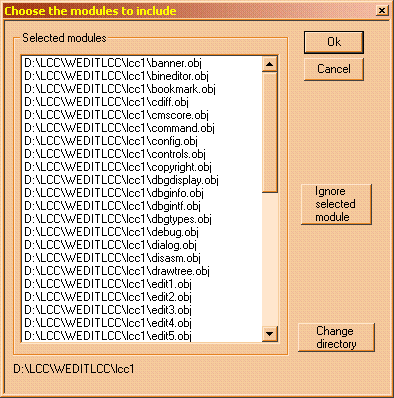
Wedit: The
Integrated Development Environment
Command Line
Arguments
Wedit understands the following command line parameters :
|
Argument |
Meaning |
|
/prj : project-name |
Opens « project-name » at startup. This name should be a valid project already created in previous sessions. Example : Wedit /prj :parser This opens the « parser » project. |
|
/f |
Opens no projects or windows. |
|
/w |
Opens no projects or windows and does not show the startup banner. |
|
executable-name more args |
Starts the debugger and debugs the executable named in the command line. Passes all further arguments to the program that will be started. For instance, if you want to debug foo.exe with arguments silent and fast, write : Wedit foo.exe /silent /fast Note that the .exe extension is mandatory. |
The
Main Menu
To know the purpose of any menu option in Wedit, open the menu and run the mouse over each item. A short explanatory text will be shown at the lower right of Wedit’s window.
Following is a description of all menu entries:
File: Opens and closes files, renames or saves the current file, opens or closes a project.
|
Item |
Description |
|
New |
Creates a new text file, a new Wedit window, or a new project. |
|
Open |
Opens an existing file. |
|
Open binary |
Opens an existing file and calls the binary editor to edit it. |
|
Insert a file |
Inserts a text file at the current cursor position. |
|
Save |
Writes the current document to disk. |
|
Save as |
Renames the current document and writes it to disk. |
|
Save all |
Writes to disk all modified files. |
|
Reload |
Discards any changes to the current file and reloads it from disk. |
|
Set read-only |
Makes any modifications to the current file impossible. |
|
Close |
Closes the current document. |
|
|
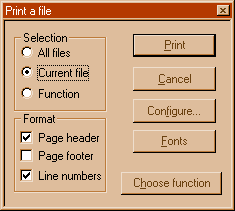
Prints the current file or all loaded files. |
|
Quit |
Closes Wedit. |
Edit: Text manipulation including moving blocks of text, reformatting the current document, inserting a file, and other commands.
|
Undo |
Undoes the last action. |
|
Cut |
Erases the current selection saving it in the clipboard. |
|
Paste |
Copies the contents of the clipboard to the cursor position. |
|
Copy function |
You choose a function and Wedit copies it to the clipboard. |
|
Copy to file |
Copies the contents of the clipboard to a file. |
|
Level |
Shows the bracket level. |
|
Mark block |
Marks the current block (where the cursor is). |
|
Spaces->Tabs |
Converts all white space to tabs if possible. |
|
Tabs->Spaces |
Replaces all tabs with their equivalent in spaces. |
|
Recenter |
Recenters the cursor in the screen. |
|
Description à Function |
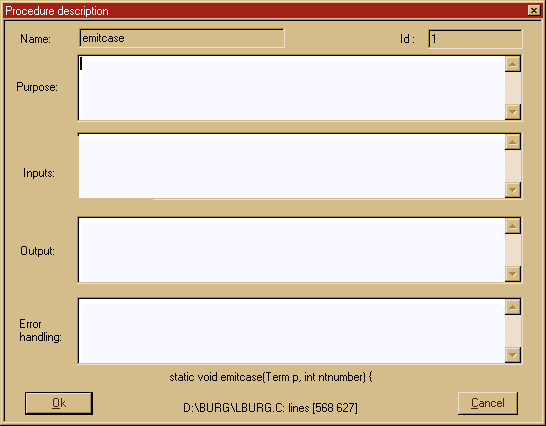
Edits a standard description of a function. |
|
Descriptionà File |
Edits a standard description of a file. |
|
Show changes |
Shows the changes made to the current document. |
|
Reformat |
Reformats the program, adding indentation. |
Search: Searching or replacing character strings or regular expressions, identifying a file, searching for a function, GREP.
|
Find |
Searches for a character sequence. |
|
Find next |
Searches for the next occurrence of the previous search. |
|
Find previous |
Searches backwards. |
|
Replace |
Replaces one character sequence with another. |
|
Find in files |
Searches for a character sequence in a set of files. |
|
Goto Top |
Sets the cursor at the beginning of the file. |
|
Goto end |
Sets the cursor at the end of the file. |
|
Goto line |
Prompts for a line number and sets the cursor there. |
|
Goto Previous function |
Sets the cursor at the beginning of the previous function. |
|
Goto Next function |
Sets the cursor at the beginning of the next function. |
|
Goto Bookmark |
Prompts you for a bookmark and sets the cursor there. |
|
Bookmark set |
Establishes a bookmark at the cursor position. |
|
Bookmark goto |
Moves the cursor to a chosen bookmark. |
|
Bookmark goto next |
Moves the cursor to the next bookmark. |
|
Bookmark delete |
Erases a bookmark. |
|
History |
Shows the list of visited functions for the current session. |
|
Functions list |
Shows the list of all functions defined in the current file |
|
Structures list |
Shows the definitions of all structures defined in the current file |
|
Search a function |
Shows the list of all functions defined in all loaded files. It allows for regular expressions for searching. |
|
Search definition |
Moves the cursor to the definition of the symbol currently under the cursor. |
|
Symbol usage |
Shows all occurrences of a symbol,i.e. where its used. Comments and strings aren’t included in the search. |
|
ID |
Sets a character string containing the file nameand date of last save. This string will be in the executable and can be searched to know which files and which version of those source files were used to build the executable |
|
Identify file |
Searches the character strings generated by the ID feature. |
Project. Project-related options (reading, opening, creating, modifying, etc.) and the general configuration wizard.
|
Configuration |
All the configuration options for the compiler, editor, debugger, linker, help files, etc. |
|
Create |
Starts the creation of a new project. |
|
Open |
Loads an existing project. |
|
Close |
Closes the current project. |
|
Erase |
Erases a project you choose. |
|
Add/Delete files |
Inserts or deletes files from the current project. |
|
Import |
Allows the user to browse for a project file (with the .prj extension), and loads it into the projects list. This closes the current project (if any). |
|
Open all files |
Opens all the
files defined in the current project. |
|
Workspace |
Shows the modules of the current project. You can add/delete modules, switch from one source file to the next, and many other options. You turn on those options using the right mouse click. |
|
After this entry |
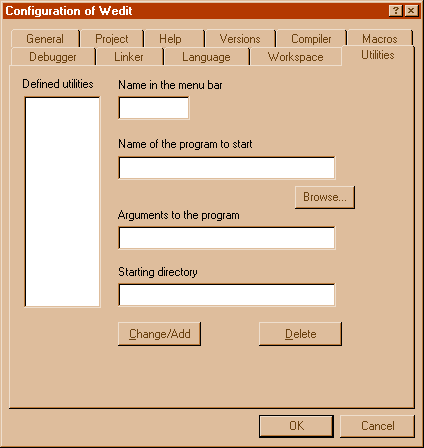
All user-defined menu commands, added with the add utility option in the configuration tab, start at this point. |
·Resources. Resource editor.
|
Open/New |
Creates or opens a resource file. |
|
Show directory |
Shows all the types of resources defined and each one of the objects. |
|
Symbols |
Opens the symbol editing dialog box. With this you can add/change symbols assigned to controls. |
|
Group |
Opens the group and hierarchy dialog box. Here you can establish the tab sequence and set the group separators. |
|
New |
Inserts a new object. |
|
Alignment |
Aligns the selected objects. |
|
Spacing |
Opens the spacing dialog box. |
|
Same size |
Resizes the selected controls to the same size of the dominant control. |
|
Buttons |
Positions the buttons either at the right or at the bottom. |
|
Zoom |
Starts the zoom utility. |
|
Config |
Opens the configuration dialog box of the resource editor. |
|
Output |
Shows the name of the output files. |
Compiler: Compiler specific options. Make, Makefile generation, link, debug, execute, etc.
|
Make |
Calls the Make utility to build the current executable. If the Make utility is running, there will be an entry to stop the building process at this point. |
|
Shows results |
Shows the results (errors or warnings) of the last compilation, if any. |
|
Link |
Calls the link editor. |
|
Generate Makefile |
Generates an ASCII text file (Makefile) that specifies the dependencies of the project files to the Make utility. |
|
Rebuild all |
Erases all object files and starts a build. |
|
Debugger |
Starts a debugging session. |
|
Breakpoints |
Calls up the breakpoint editing dialog box. |
|
Set breakpoint |
Sets a breakpoint at the current position. |
|
Execute |
Runs the executable of the project. The arguments to the program (if any) are the ones specified in the debugger configuration tab. |
|
Compile |
Compiles the current file. |
· Debug. This menu option appears when the debugger is active, in the place of the compiler menu, assuming you do not compile when the program is being debugged.
|
Execute |
Continues the execution of the program. Breakpoints remain active. |
|
Step in |
If the current line contains a function call, the debugger will step into that function, provided there is debug information for it. If there is no function call, the program is stopped at the next line. |
|
Same level |
Continues the execution of the program until it reaches the next source line. |
|
Step out |
Continues the execution of the program until it leaves the current function. Breakpoints remain active and can stop the execution of the program before the end of the function is reached. |
|
Run to cursor |
Continues the execution of the program until it reaches the line pointed to by the text cursor. If that line is never reached this is equivalent to Execute. |
|
Stop debugging |
Stops program execution and returns to the editor. |
|
CPU |
Shows the machine register window. |
|
Stack |
Shows the execution stack. |
|
Memory |
Allows you to inspect memory locations. |
|
Machine instructions |
Shows the disassembly window. |
|
Watchs |
Shows the watch window. |
|
Evaluate symbol |
Shows the symbol evaluation dialog box. |
|
Info |
Shows information about the program current running, its threads, its windows, etc. |
|
Restart |
Stops the current process, terminates it, and restarts the debugger, stopping at the main or WinMain function. |
|
Break |
Immediately stops the execution of the program wherever it is. |
|
Breakpoint |
Sets a breakpoint at the current position of the text cursor. |
|
Edit breakpoint |
Shows the breakpoint editing dialog box. |
|
Data breakpoint |
Allows you to set a breakpoint that will be triggered when the program accesses a certain memory location or variable. |
Utils: Several help programs such as diff, generating a hypertext file from a program file, information about variables, structures, etc.
|
Execute |
Runs a specified program. |
|
Diff |
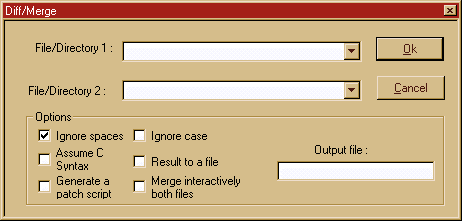
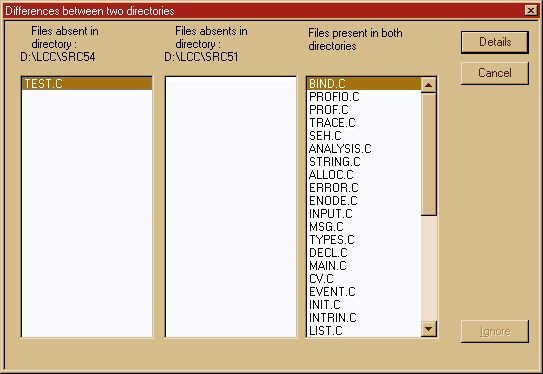
Calls up the diff utility to determine the differences between two files or two directories |
|
Profiler |
Calls up the profiling utility to determine where your program uses its time. |
|
Analysis |
Analyzes the project or a file. The detailed menu options are described below. |
|
Apply patch |
Applies a patch file. This option is not currently functioning well. The patch should be generated with the diff option ‘generate patch’. |
|
Database wizard |
This will appear if Berkeley DB of Sleepycat Software is installed |
|
Show #ifdefs |
Redraws the current file showing inactive lines in gray. |
|
Executable stats |
Shows the size of each part of the executable: code, data, etc. The DLLs used are also shown. |
|
Function size stats |
Determines all sizes of each function in the executable of the project file, sorts it by size, and displays the result in a normal editor window. |
· Analysis. These commands allow you to browse or get other information about a specific file or about the project as a whole.
|
Import foreign library |
Allows the user to read a dll import library in the Microsoft format, and transform it into a library in the lcc format. |
|
Show #includes |
Shows all the include files in the current open file. The display is in the output window. |
|
ObjXref |
Shows a cross-reference of all object files created by the current project, showing which functions are defined, but not called from other files, for instance, or a graphical plot of the object files relationships: which files call which. |
|
Function tree |
Prompts for a function in the current file and shows which functions are called by that function. |
|
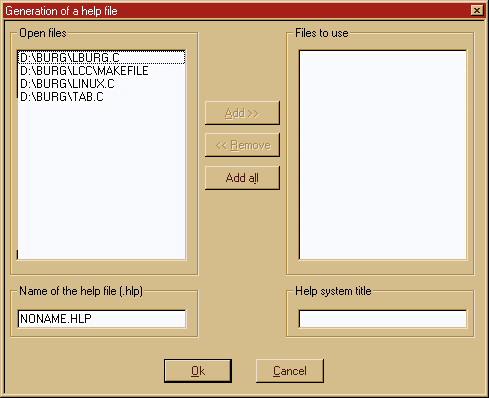
Generate HLP |
Generates a help file automatically with the definitions of the functions in your program. |
|
Strings |
Allows you to automatically replace the character strings in a source file by a reference to either a table or a resource. |
|
File metrics |
Shows the software metrics for the current file. |
|
Function metrics |
Shows the software metrics for the specified function. |
|
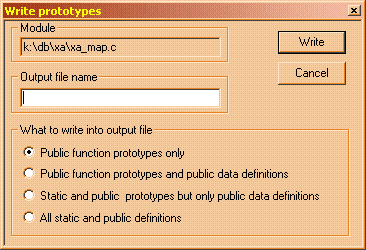
Write prototypes |
Writes in a specified file the prototypes for the functions in the current file. |
|
Browse fn defs |
Opens a dialog box showing you all defined functions in the files currently opened. |
|
Show globals |
Shows the global variables of the current file. |
|
Slice by local |
Shows the lines that concern a specific identifier, i.e., a program slice. |
|
File relations |
Shows the relationship between two given files. |
|
Audit |
Writes a document with all metrics of all loaded functions. |
Versions: Versioning system. Get, put, seeing revisions, maintain CMS files and in general all versioning options.
Window: All loaded files are listed here.
Wedit has a status window at the bottom. Here, you can see the output of different things: GREP, make, the debugger, the locals display, etc. This window can be shown using the button at the lower left of Wedit, or hidden, using the same button. At the bottom right, you will find the current function for where the cursor is located, if any, and the current line and column number.
The list in the output window is a ‘dockable’ window. You can detach it from the main Wedit window, and so that it becomes an independent floating window that you can place anywhere in the desktop.
To force this window into its home position, just double-click in the window’s title bar.
How Wedit Displays the
Program Text
|
|
You
can toggle the open files toolbar on/off with the corresponding option in the
Configuration property sheet. It is an independent window that can be placed
anywhere in the desktop. Wedit
will remember its last position and re-open it when restarting. |
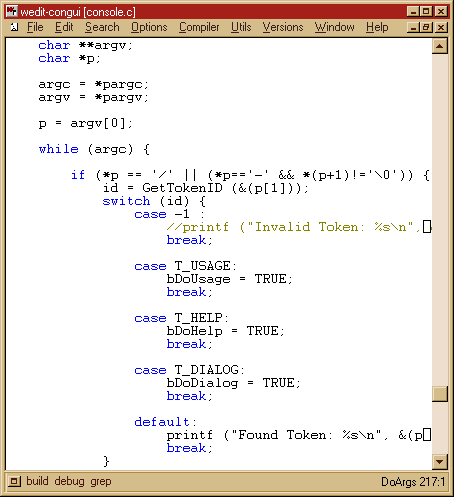
C language keywords are displayed in blue, commentaries in light green, text in black. You can alter these colors as desired using the corresponding option in the Configuration property sheet. Lines that are bigger than the display window are finished with a white square. The name of the current function, the line number, and the current column are displayed at the lower right corner of Wedit’s window. If the file has been modified, an asterisk will be added after the column number.
There is no horizontal scrollbar. Click near the vertical scrollbar and the screen will move to the left, click at the opposite side and the screen will move right.[1]
You can make Wedit show you the braces level by choosing the ‘Level’ option in the ‘Edit’ menu. A column with the level of each line appears at the left. To make the ‘level’ disappear just choose the same option again.[2]
You can save disk space by using the ‘Spaces to tabs’ option in the ‘Edit’ menu. This function will replace all leading spaces with tabs, so your file uses less disk space and loads faster.
If you have made changes and want to discard them, the fastest thing to do is to choose the ‘Reload’ option in the ‘File’ menu. This will reload the file from disk, disregarding all changes.
If you want to see what changes you have made to a file, use the ‘Show changes’ option in the ‘Edit’ menu.[3]
To display two files side by side, use the ‘Disposition’ option in the ‘Window’ menu. You can position the files side by side vertically or horizontally.
The button at the lower left corner is used to show/hide the output window. This window can be detached and moved freely around by clicking in the bands of free space between the output window and the borders. In addition, its height can be arranged by moving the slider in the middle. To do this, press and hold your mouse button for more than one-half second when the mouse is over the slider. The slider window will then be ready for resizing. It will show a horizontal bar that can be used to adjust the height of the output window.
Pressing the right mouse button above the area of the output window will bring up a contextual menu. With this, you can save the actual contents in the output window to a file.
Projects
A project is a set of source files that contains the code for an executable or a library. This set of files can include header files and many other associated documents such as documentation, etc. For Wedit, however, you should only indicate the C source files, RC resource files (or their binary equivalent, the .res files) and no other files.
Creating a Project
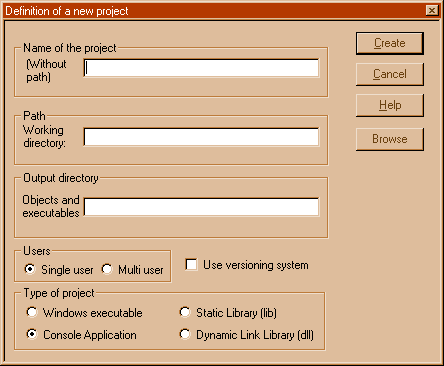
This option allows you to define the set of files that will be loaded together and considered as a work unit. For this you have to define:
The name of the project
The directory where the source files will be found
The object files and the executable are placed by default in a directory named 'lcc' under the sources directory. For instance. if you use the directory c:\myproject for the sources, the output of the compiler will be placed in a directory named 'c:\myproject\lcc'. This method is not obligatory in this version, but it was in earlier versions of Wedit. Still, it is better (as always) to use the defaults.[4]
Avoid placing two completely unrelated projects in the same
directory. The makefiles would be erased and several object files could be
lost. For example, if you have a file called main.c in two projects, the object
files of both projects would be the same and the linker would be confused.
Four types of projects are supported:
Windows executable. This means that your program will start at the ‘WinMain’ function, that it will not use the standard input or standard output functions and that it will not use the ‘console’ window.[5]
Console application. This means that your program uses ‘printf’ and assumes, for example, that stdin and stdout are initialized and it will appear in a text mode window.[6]
Static library. This means that you want to create a library containing a set of object files. This library is linked statically, i.e., each executable will contain its own copy of the routines in the library.
Dynamic link library. This means that you will create an executable that is dynamically attached to another process when the other executable starts.
|
|
Creating Several Projects under the
Same Directory
From the same source set, you can create different projects that use some of the files in the sources directory. For instance under the project \myprojects\accounting, you could create several projects that use some of the same sources under that directory for setting up different executables, a DLL, a library, etc. You can do this if you change the item ‘Project directory’ in the definition of the project. Since the object files are stored in different places, there is no risk of mixing them up.
Defining the Files to be used by the
Project
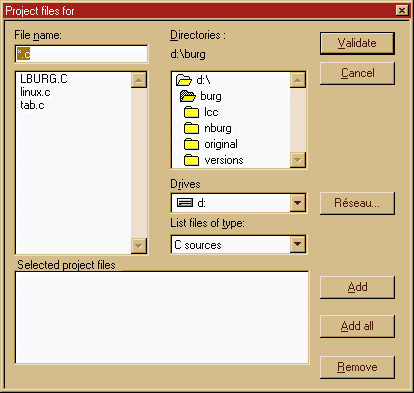
When you accept by pressing the 'Create' button, the system will ask you if you want to use the wizard to generate the code for the skeleton of a new application. If you answer yes, the code generation wizard starts. If you answer no, the following dialog box appears:
|
|
You
reach this dialog box either by choosing ‘Create’ in the project options, or
by choosing ‘Add/Delete files’. This
is the standard dialog box for project file maintenance. To
add a file, choose a file from the list box at the upper left or type its
name in the corresponding entry field, then click on the ‘Add’ button. To
remove a file, select it first in the list box at the bottom, then click on
the ‘Remove’ button. |
Here you should enter the names of all files that will create this project. You can enter them quickly if you click on the ‘Add all’ button.
If your project uses special libraries, add them to the project files here. For instance, if you want to use the Windows sockets primitives for network programming add ws2_32.lib. You can enter the library without a path. If no library is found in the current directory with the name you typed, Wedit will search in the system \lcc\lib directory, and determine the path for you.
If you are building a Windows executable, you should add your resources, either by adding a .rc file or a binary .res file. Use the combination box with ‘List files of type’ header to choose the different files that you want to add to the project.
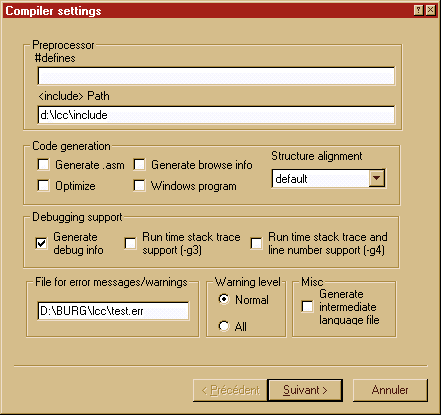
When you have chosen all the files, click the ‘Validate’ button and the following dialog box will appear.
|
|
You
can reach this dialog box either when you create a new project or by using the
‘Configuration’ option from the ‘Project-Configuration’ menu bar. |
This dialog box lets you change/add/modify the settings for the compiler, choose the level of debugging support, etc. This will be explained in full in the corresponding chapter. This is the same dialog box that you reach from the ‘Configuration’ tab in the ‘Options’ main menu. It is just displayed differently.
This is the first of a series of three dialog boxes that the system presents to you in the event that you want to modify some of the settings at the start of a project. Choosing the ‘Next’ button allows you to continue.
This is a good place for adding the #defines that your project may need or a special library that is not included in the default libraries. By default, the compiler will start the project with a debug setting (debug information turned on, optimizations off), but you can also change this here.
The next two dialog boxes (shown later in the ‘Compiler’ chapter) concern the linker and the debugger settings. Once finished with the settings, Wedit will generate a Makefile for your application using the available information.
The project is then ready. You can compile and execute your application. You should wait, however, until Wedit finishes generating the Makefile for your application. This can take a few seconds, since Wedit calls up the compiler to determine which files are used for each of the files you added to the project.[7]
The structure of the Makefile that is generated is described in the technical documentation.
Opening an Existing Project
This option allows you to change the current project. All open files will be closed and the current project will be saved. The windows with the files of the new project will be opened as you left them the last time you worked in them.
To open an existing project, click in a project and Wedit will open it. When Wedit opens a project, it will hide the main window to accelerate the file loading time without any unnecessary repainting. You may be concerned that Wedit has crashed/disappeared if it takes a long time to open. This is not the case.
You can open several projects by checking the button at the bottom of the dialog box. If that button is checked, Wedit will open a new window with the new project instead of closing the current project and opening a new one.
Opening a project file
When you have a project file and you want to add the project to the list of your projects you can use the « File à open » menu option to open the project file and automatically read-in the project description.
Configuring Wedit
|
|
Here you can customize several options, such as the what an editor will do at a new line (indentation or not), which font to use, whether or not a backup copy should be made, the language definition, etc.
This tab allows you to change:
1. Whether the editor will make a backup of the old version when saving a file. This backup file contains the text of the file as it was before saving and has the same name as the saved file, with a different extension (xxx).
2. Whether the editor shows the floating toolbar. This toolbar will show the names of all loaded files so that you can quickly change from one file to the next. This is useful when you have a large number of files loaded.
3. Whether the editor saves the changes to its configuration when quitting. This can be turned off if you have modified parameters you do not want to keep for future sessions.
4. Whether the editor will indent automatically when you press the carriage return.
5. Whether the editor will check for syntax errors like mismatched parentheses or brackets when saving a file.
6. Whether the size of the fonts in the output window should be small or normal.
7. Whether the editor will save all modified files before starting a build.
8. Vertical scroll options. You can use three modes of downward/upward scrolling when you use the up/down arrow in your keyboard. You can have the normal scroll, i.e., one line at a time, or ‘smooth’ scrolling, where Wedit moves scrolls a smaller fraction of a line each time, and ‘very smooth’, where Wedit scrolls through the text slowly.
9. The tab size: You enter a number between 1 and 8 here.
10.Auto save. If enabled, the editor will save the modified files regularly every 3 minutes. The saved files are in \lcc\autosave.
|
|
The current directory. Use the edit field at the bottom of the tab to change it. |
|
|
Change the location where Wedit will look for the compiler if you moved it to another location or you want to use another version of the compiler; a version that you compiled yourself for instance. |
Exporting/Importing
Projects
Each project is
stored in the registry under the key:
HKEY_CURRENT_USER\Software\lcc\Wedit\<project name>
You can ask Wedit to write all the values of all the keys of a given project with the ‘Export’ option in the ‘Project’ menu. The values will be written into a file called <project name>.prj, in the project’s sources directory. This file will be used by the corresponding ‘Import project’ option to read all the values into the registry.
If you are moving a project from one place to another on your disk or to a different machine in another context, you can edit the paths in this file so that they correspond to the configuration you changed. For instance, if you move a project from drive D:\projects\work to drive K:\shared\lcc, you should edit the paths in the generated text file to reflect this new configuration.
The keys used by Wedit are:
|
Key name |
Meaning |
|
PrjFiles |
Number of files that contribute to the project, regardless of whether they are open in the editor or not. |
|
File1 … FileN |
The names of the project files. If they do NOT have any path information, the value of the key “SourcesDir” is implicitly assumed. |
|
UserCount |
Number of people working in this project. |
|
User1 … UserN |
Names of each user. |
|
CMS directory |
Directory where the versioning system stores its data. |
|
Put options |
Versioning system data. |
|
GetOptions |
Versioning system data. |
|
FileOptions |
Versioning system data. |
|
LockOptions |
Versioning system data. |
|
UserOptions |
Versioning system data. |
|
ProjectFlags |
Versioning system data. |
|
Frame |
Coordinates of the main window. |
|
StatusBar |
Coordinates of the status bar. |
|
Name |
Project name. |
|
CurrentFile |
Last file open in this project. |
|
OpenFiles |
Number of open files. |
|
OpenFile1…
OpenFileN |
Paths of all the open files, followed by the coordinates of each window in pixels. |
|
ProjectPath |
The working directory last time the project was closed. |
|
SourcesDir |
Directory in which the sources are saved. |
|
Defines |
The #defines to be added to the compiler command line with –Dxxx. |
|
Includes |
The additional include paths for this project to be added to the compiler’s command line with –Ixxx. |
|
Libraries |
The additional libraries to be added to the linker’s command line. |
|
LinkerArgs |
Additional arguments to be passed to the linker. |
|
MakeName |
Path of the Make utility. Usually \lcc\bin\make.exe. |
|
MakeArgs |
Arguments to be passed to the Make utility. Usually empty. |
|
MakeDir |
Directory where the object files are stored, together with the Makefile that was generated. |
|
Exe |
Name of the resulting executable for this project. |
|
DebuggerArguments |
Arguments to be passed to the program when started. This is used by the ‘Execute’ command and by the debugger. |
|
DbgExeName |
Executable to be started by the debugger. This is different from the executable name only in the case of a DLL. |
|
DbgDir |
Directory where the debugger should start the program. |
|
CompilerFlags |
Flags describing the compilation options. |
|
FortranFlags |
Fortran compiler flags. |
|
EiffelFlags |
Eiffel compiler flags. |
|
NumberOfBreakpoints |
How many breakpoints are defined in this project. |
|
Breakpoint1 …
BreakpointN |
Breakpoint description. |
The project description files are just text files with the .prj extension, which are saved in the project’s source directory when the project is exported. Wedit will translate some of the paths stored here to be relative to the project directory when importing, and will ignore some keys, for example, MakeName, if the contents are different from the configuration of the machine retrieving the project. For instance, if you export a project in a machine that has lcc installed in c:\lcc to a machine that has lcc in k:\shared\compilers\lcc, the Make utility that will be called up is k:\shared … and not the one in the exported project.
Complex Projects
There are some situations when you need to process a file with another tool, not the compiler, to obtain a C source file. For instance, the compiler sources themselves require the ‘lburg. exe’ utility, which will build a C file from a machine description file. This machine description file is stored in win32.md.
To describe this project to the IDE, add win32.md to the project files. Wedit will notice that it cannot determine how this file will be processed, since it does not end with the standard extensions .c, .asm, .obj. It will open up a dialog box asking for more information. In that dialog box, enter the command line that should be executed when this file changes. In this case, enter :
lburg
win32.md win32.c
You also need to specify the output of this command. The output in this case is a file called « win32.c », which you add to the project files.
In a much simpler way, you can specify .asm files that will be processed by the compiler, assuming lcc assembler syntax. If you want your assembler files processed by another assembler, such as NASM, right click on the open file and add a ‘file processor’ for that specific file. If, for example, you have your assembler functions in a file called asmcalls.asm, you open asmcalls.asm, add it to the project, then right click somewhere in the text of that file. Then add « nasm.exe » as a file processor or \utilities\bin\nasm.exe « if the tool is not in the path.
The Workspace Options
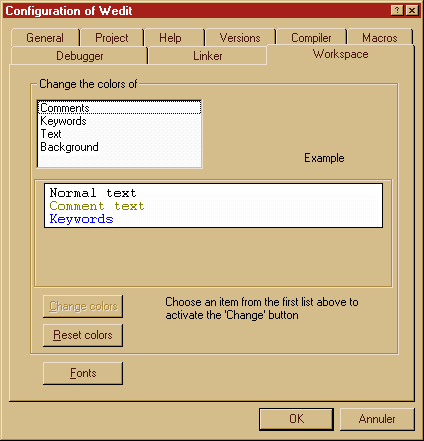
These options allow you to modify the fonts and the colors used by the editor.
|
|
You can reach this tab from the ‘Configuration’ option of the menu, and then ‘Workspace’. |
|
|
·Colors: To change the colors, first select the type of text you want: normal text, commentaries or keywords, then press the ‘Change colors’ buttons. You can choose a color and Wedit will use it to the type of text you selected. · If you get lost and would like to return to the default colors, you should use the ‘Reset colors’ button. · Fonts: Press this button and choose a font and font size. Wedit is capable of displaying proportional fonts, but in general, programs do not look good when displayed in these font types. Use non-proportional fonts such as Courier. |
From the ‘Fonts’ button, you can change the font and the size of the font used by Wedit. Proportional fonts are not recommended. They are supported, but not well tested because programs do not look good with these fonts.
Defining Macros
|
|
|
The purpose of this tab is to allow you to define simple macros using the keys Ctrl+’A-Z’, which will insert the desired text at the current position.
You must supply Wedit with the following information:
1. The letter (a-z) that will be used for the macros. This is entered in the small square at the top.
2. The replacement text you want introduced at the current position when this macro is used.
3. When you have entered the information in both fields, press the ‘Add’ button to enter the new macro into the list of defined macros.
For example, if you want the macro Ctrl+i to represent
i =
MyCurrentStructureWithLongName[MyCurrentIndex]
you would enter ‘i’ in the box, and the contents in the edit field below, then press the add button. This creates the macro.
Finding or Browsing Information with Wedit.
Wedit constructs implicit links between symbols in your source files as you edit them. It records where functions are defined, where structures are used, and other 'important places'. It can show you the definition of symbols by pressing F8 .
Information can be displayed in several forms, according to their type: variables, structures, functions, globals, locals, etc.
Press and hold down the right mouse button to recall the definition of any symbol under the mouse pointer. A contextual menu appears, showing you the different options available. The different options are:
·Definition. Wedit will show you where this symbol is defined.
·Usage. Wedit will show you where this symbol is used in the current file. Comments and character strings are ignored.
·Documentation. Wedit will call up the Windows help with the given symbol. You should use this with symbols that are documented in the windows API.
If you click with the right mouse button where no symbols are defined, Wedit will show you the following options:
·Globals. This will show all global variables in the given file.
·Functions. This will display the list of all functions defined in the current file.
In addition to these options, the following options are always available, regardless of where you clicked:
·Metrics. This will show you the software metric measurements for either a symbol or the whole file.
·Edit description. This will prompt you with the standard function description dialog box.
·Properties. This will show you the exact path of the current file.
If you right click on include statement, Wedit will automatically open the included file. If you right click on an ifdef, a new item will appear prompting you to bring the cursor to the matching endif. The same occurs if you right click on an opening or closing brace.
If you right click on a function definition, Wedit will prompt you to show the local variables of the function. This allows you to see slices of the function’s code by variable.
The Workspace view
This button allows you to see the contents of a project.
If you click on the name of the function with the right mouse button, a menu appears in which you can to see some information about that function. If you double-click on a function name, the cursor will be positioned at the beginning of that function's definition.
The ‘Name Completion’ Feature
When you type the start of an identifier and press the Escape key, Wedit will try to find the closest match to the incomplete identifier. If only one match is found, it will be inserted without further questions. If multiple matches are found, you will be presented with a contextual menu with those identifiers or with a dialog box if the number of identifiers found is too great to be presented in a menu.
If you press Escape after having written an identifier followed by a point or a sequence of ‘->’ characters, Wedit will try to find the fields of the structure you are writing.
Wedit tracks the include files to search for identifiers. Comments will be ignored, but conditional definitions will not be executed because for this, the preprocessor would have to run.
Information
About your Symbols (Variables, Functions, etc.)
Finding the definition of a
structure
The difference between Wedit and other editors is that it can show you the information you need more quickly than simply using GREP. To do this, press F8. This will instruct Wedit to search for the definition of the symbol that is currently under the cursor.
If the symbol corresponds to a function whose definition is in a currently loaded file, the cursor will be moved to that file and positioned at the beginning of the function definition.
If the symbol is a global or a local variable of the current function, its definition will be displayed in a new small window. If the symbol or variable is a structure, its definition will be included in the new window.
If the symbol corresponds to a typedef, only its definition will be shown.
Following is a sample display after F8 is pressed while the cursor is below the word rule:
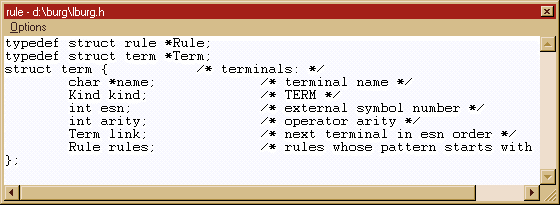
The ‘Options’ menu allows you to open the file from the definition and puts the cursor at the beginning of the definition. You can also print the contents of the structure.
Finding the Usage of a Symbol
Press the accelerator
keys, Ctrl+F8, to go to this option. It will use the symbol under the cursor to
show all lines in all loaded files where the given symbol is used. This is
similar to the GREP utility, but it ignores commentaries and character strings.
Finding the Definition of a Function
To us this option, place
the cursor on the name of the function and press F8. This will take you to the
function definition if that function is loaded into the editor. As with other
options like this, it is very useful to load all source files of a project in
the editor.
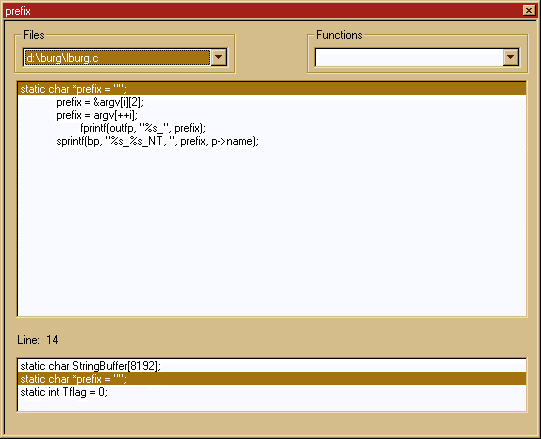
The ‘Files’ combo box shows you which files use the symbol, the ‘Functions’ combo box shows you which functions use it. You can change the context displayed by clicking in a line from the main list box.
Searching for a Function
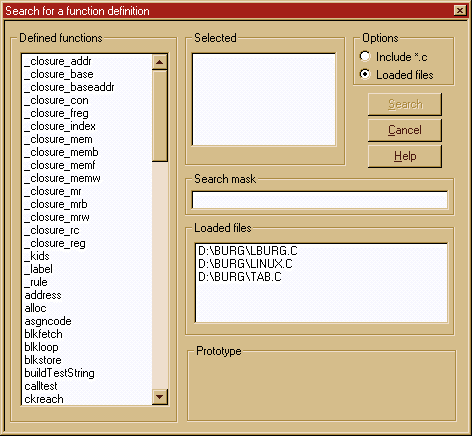
This option is complementary to the preceding one. It is useful when you are uncertain of the function name you are searching. To search using regular expressions, select the "Function" option from the "Search" menu.
The following dialog box appears:
|
|
You
can reach this dialog box by using the ‘Search a function’ option from the
‘Search’ menu bar. |
The list of all functions defined in all loaded files appears at the left, sorted by name. If you double-click on a function name, the dialog box will close and the cursor will be placed where the function is defined. The prototype of the selected function is shown at the lower right.
If you double-click on the list of files in the center-right, Wedit will open a new list with all of the functions defined in that file.
You can indicate a filter in the entry field at the center.
This filter can be a regular expression. After the filter is applied, if any
functions are found, they will be shown within the list of selected functions.
For instance, to find all functions that begin with a capital 'C', the regular
expression will be "^C.+"
The ‘Include *.c’ button at the upper right instructs the search engine to look for all files in the current directory (that end with .c) and not only in the loaded files.
Displaying
the List of Functions in
the Current File
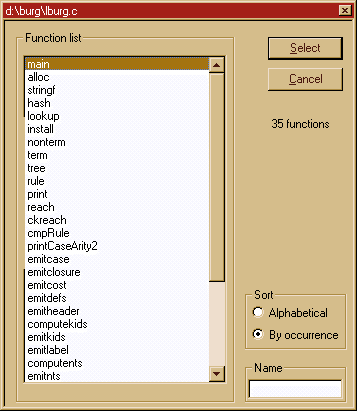
This dialog box does not use the information in the file. If you have just written a new function and you have not yet saved the file, this dialog box will also accurately show you the new function.
|
|
You can reach this dialog box either by using the F12 function key, or by selecting the ‘Function list’ option in the ‘Search’ menu bar. |
To go to the function definition, select the desired line from the list.
The small entry field at the right allows you to enter the function name if you know it.
You can sort the functions by occurrence in the input file or by name.
Since the #ifdef / #endif are not taken into account, the same function can appear several times. In addition to this problem, the assumption here is that there are no fatal syntax errors in the text of the file being scanned. Most syntax errors will not affect this option, except unbalanced brackets, unfinished commentaries, or similar syntax errors.
Editing Text
Selecting and Moving Text
To select a piece of text, use the Shift key with the arrow keys. The options are listed in the main menu. For instance, to select a line, press Shift+down arrow.
Once selected, the text can be copied to the clipboard with Ctrl+Ins. The clipboard is exported immediately when the selection is copied and is available via the clipboard to other applications in the system.
To move a whole function, use the Copy function option from the Edit menu. This will copy the selected function to the clipboard. You can then delete it and place it somewhere else.
To insert text from the clipboard, use the Shift+Ins keys. To insert a file at the cursor's position, use the Insert file option from the File menu.
Searching Text
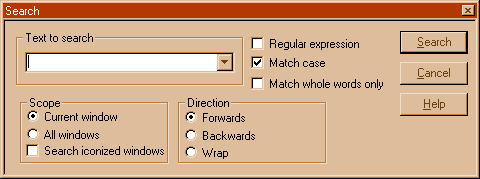
This option allows you to search for a text string or for a regular expression in the current file or in all opened files.
|
|
The different options indicate:
Scope: Can be the current window or all opened windows.
Type of Match: The character string can be used literally or as a regular expression.
Symbols only: The text is a symbol and only matches that are delimited by non-symbol characters will be reported.[8]
Match case: Whether case is important when searching.
Direction: You can search forward (towards the end of the file) or backward (towards the beginning of the file) or make the search wrap at the end of the file and start at the beginning.
Replacing Text
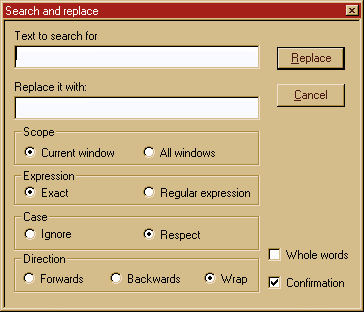
This dialog box can also be used to specify the replacement of a variable or any character string. The search can be global (i.e., all loaded files) or only within the current file.
|
|
You can reach this dialog box by using the
‘Replace’ option in the ‘Search’ menu bar Alt+s, then r. |
The user interface is simple: Type in the text and the replacement text, then press the Replace button. The search expression can be a regular expression. If this is the case, do not forget to select the corresponding option in the Match group box.
Possible options are:
Use of a confirmation dialog box or if Wedit should replace all matches globally without confirmation of each occurrence.
Identifier search: Implies that to be a valid match, non-identifier characters should enclose the text. This allows you to replace all occurrences of the variable 'j' in 'z' without replacing all j's in z's!
The Scope field: Specifies that the files will be included in the search. Either the current file or all loaded files can be used by the search.
Case: Specifies if the search should be case sensitive.
Direction: You can search towards the end of the file, towards the beginning of the file. If you choose a global search, it searches forward only.
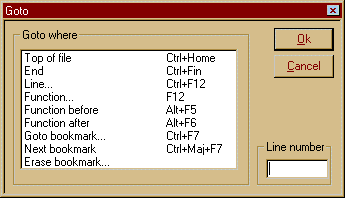
Goto
The Goto option from the search menu leads to the following dialog box:
|
|
You can reach this dialog box by using the ‘Goto’
option in the ‘Search’ menu bar. |
This option allows you to move the cursor within the current file. Top and End place the cursor at the beginning or at the end of the file, respectively. Line is used to move the cursor to a specific line. You can skip the subsequent dialog box if you enter a line number in the corresponding entry field at the lower right corner of the ‘Goto’ dialog box.
|
|
You can reach this dialog box by selecting the ‘Goto’ option in the
‘Search’ menu bar. A dialog box will show you several options, you choose ‘Goto
line’. Or you can press the keys Ctrl+F12 and you arrive directly. Ctrl+F12 |
The editor remembers the lines entered during an editing session.
The Function option allows you to place the cursor at the beginning of a function definition. The editor will show you a list of the functions defined in the current file.
Matching Parentheses, Brackets, etc.
This function allows you to match braces, brackets and parentheses or a #ifdef / #endif construct. To use it, place the cursor just before the letter in question and press F11. The cursor will be moved to the corresponding element. If you press F11 again, the cursor will return to the original position. This works in either direction. This functionality will be called each time you save a file, to check that parentheses and brackets match.
Bookmarks
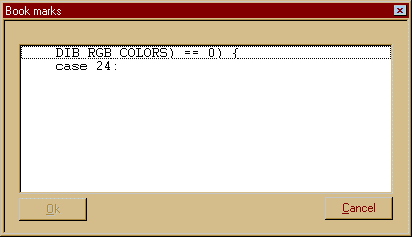
You can set bookmarks at any line within a file to establish a point where you can return to. To set a bookmark, press F7 on the desired line. To return to a bookmark, press Ctrl+F7. The editor will list the bookmarks established thus far.
|
|
You
can reach this dialog box by pressing the CTRL+F7 keys or by using the ‘Goto’
dialog box in the ‘Search’ menu bar. |
Choose a line and the cursor will be placed there.
The same dialog box is used for deleting a bookmark. Select a line and the bookmark will be deleted.
You can scroll through the bookmarks using the Ctrl+F7 keys.
Redefining
what is a keyword
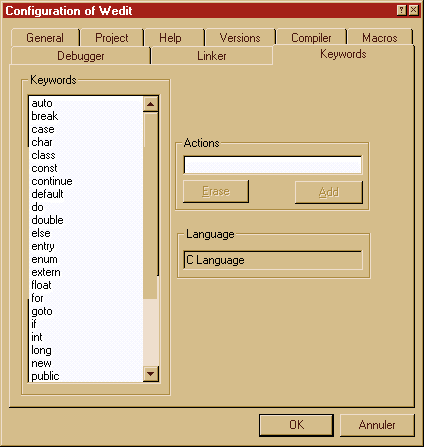
You can add or delete keywords from the default keyword list. It can be useful to see your own types in the keyword’s colors. To do this, choose the Keywords tab in the configuration property sheet.
|
|
You can reach this dialog box by using the
‘Configuration’ option in the ‘Project-Configuration’ menu bar. |
You can add or delete keywords. To add a keyword, type it in the entry field and press the 'Add' button. To erase a keyword, select it from the list first, and then press the 'Delete' button.
Wedit’s
Debugger
The debugger allows you to follow the program execution and to examine values at runtime. There are two ways to start it.
· Press the F5 function key. If you have built a project, the executable will be started automatically, or
· Use the File->Open menu option, and enter the name of an executable that you want to debug. From the command line, you can specify to Wedit the name of the program to debug. If the file given has a .exe extension, Wedit will assume you want to debug it and will start.
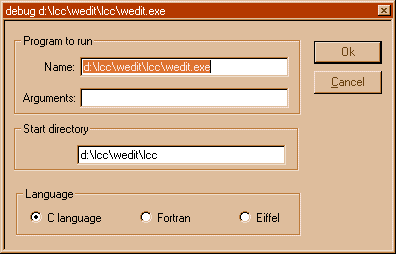
If it is not a .exe file, the following dialog box appears:
|
|
|
You reach this dialog box when you open an
executable using the ‘File’ and then ‘Open’ menu option. |
You can enter optional command line parameters here or cancel the whole operation.
The executable started should contain the debug information. If it does not, you should recompile it with the debug information turned on. This is specified in two place: The compiler tab of the configuration property sheet and in the linker tab. The first one specifies that the object files should be generated with debug information; the second specifies to the linker that the debug information should be included in the executable.
If functioning properly, the program to be debugged is started and execution stops at the ‘main’ or WinMain function.
Wedit is a multi-language debugger, however, it supports C best. For Eiffel language support, choose the appropriate button in the dialog box.
You can use the command line to start debugging a program with Wedit. If you want to debug the program « foo.exe », with the startup arguments « arg1 » and « arg2 », the command line would be:
d:\lcc\projects>
Wedit foo.exe arg1 arg2
Please note that you must write the extension: foo.exe. Writing only « foo » will not work.
Configuring the Debugger
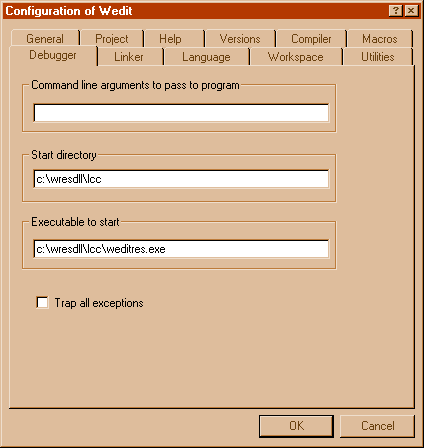
You can configure the debugger with the following tab in the ‘Configuration’ wizard.
|
|
You should verify that the start
directory is correct.
When building a DLL project, enter the name of the executable that will call up the DLL. This executable should have debug information and be linked with the DLL to debug statically. If the executable runs a LoadLibrary, instead of being linked with the DLL statically, Wedit’s debugger will not be able to restore the breakpoints you set, since the debugger cannot know in advance which DLLs are going to be loaded at which address.
Using
the Debugger: The Basics
There are several options for controlling the program execution of the program you would like to debug:
· Same level (F4). This means that the debugger will run the program until it reaches the next source line. If the current line contains a function call, it will be skipped. You remain on the same level. If you reach the end of the function, the line where the function call was implemented will be displayed. This is not possible in all cases — specifically if your function is a Windows callback, it was called up by the operating system. You cannot step through system code, so the debugger will stop when control reaches one of the source lines of your program again.
· Step in (F8). This means that the debugger will run the program until it reaches the next source line. If there is a function call in the current line, the debugger will try to see if it has debug information for the function in question. If yes, execution will stop at the first line of that function. If that function does not have any debug information, the debugger will arrange to skip that call. In cases where the function calls one of the procedures of your program indirectly, the debugger will stop when control reaches the next source line of your program. A SendMessage call is one example of this. This function will call the callback procedure for the window that can be in your program. In this case, the debugger will stop at the beginning of the callback procedure.
· Step out (F9). This means that the debugger will run the program until it exits the current function and place a stop at the calling function. The same rules apply as in the return from a procedure explained in Same level above.
· Run to cursor (F7). The debugger will put a temporary stop at the indicated line and pass control to the program being debugged. If control reaches the indicated line, the debugger will stop. If not, the program will continue normal execution. Be careful to ensure that control MUST reach the line you indicate with F7.
· Set a breakpoint (F2). This will set a breakpoint at the indicated line.
· Unset a breakpoint (F2). If the line that is under the cursor contained a breakpoint, that breakpoint will be deleted.
· Break. This makes the debugger stops the program under debug, no matter where it is.
· Stop debugging. This stops the execution of the program under debug, and closes the debugger.
· Set next statement. This can be reached through the right mouse button menu. Using this feature, you can skip several lines of code in the current function, or return backwards to retrace the execution. Note that you can make the program fail if you set the next statement where it would use variables that were initialized in a piece of code that you just skipped. The debugger cannot undo what the program has done, when you reset the current line to some line before the current one. If the program opened, closed, or deleted files, for instance, the debugger does not undo those actions.
· Set next instruction. When the ‘Machine instructions’ window is open, you can move the program counter explicitly to a new location by pressing the right mouse button anywhere on that window. A contextual menu will appear, prompting you to change the program counter to the selected line in the ‘Machine instructions’ window. To do this, choose this menu item and the program counter will be set to that location.
|
Debugger menu |
Description |
|
Execute |
Continues the execution of the program. |
|
Step in |
If the line contains a function call, the
debugger steps into the called function if debug information for that
function is available. |
|
Same level |
Stops ignoring function calls. |
|
Step out |
Stops when the current function is finished. |
|
Run to cursor |
Stops when execution arrives at the line
where the text cursor is placed. If this line is never reached, this is
equivalent to Execute. |
|
Stop debugging |
Stops the debugger and returns to the editor. |
|
CPU |
Activates the register display. |
|
Stack |
Shows the call stack. |
|
Memory |
Allows you to inspect memory contents. |
|
Machine instructions |
Activates the assembly display. |
|
Watchs |
Activates the watch window. |
|
Evaluate symbol |
Lets you evaluate a symbol or a simple
expression. |
|
Info |
Shows several information displays about the
program being debugged. |
|
Restart |
Stops the program being debugged, and
restarts it from the beginning. |
|
Break |
Interrupts the execution of the program
immediately. |
|
Breakpoint |
Sets a breakpoint at the line where the text
cursor is. |
|
Edit breakpoints |
Shows the breakpoints dialog box. |
|
Data breakpoints |
Shows the data breakpoints dialog box. |
Switching
between the Different Displays
The display at the bottom of Wedit changes when you start the debugger. The see following buttons will appear:
·
auto. Wedit tries to determine the variables that the program is working with,
and it will display them automatically
in this window.
·
locals. Wedit displays the local variables of the current function.
·
stack. The call-stack is displayed.
·
events. Events are reported, such as DLL loading, etc.
·
search. As in the editor, this is the search window.
Setting/Unsetting Breakpoints
To set/unset a breakpoint, press F2. This will toggle a breakpoint at the line where the cursor is located. If you are in the debugger, a breakpoint symbol is shown at the left side of the affected line.
You can also edit the current breakpoint list using the ‘Edit breakpoints’ dialog box, which can be called up from the debugger menu.
In this dialog box, there is a list of all functions defined in the running program at the left side. To set a breakpoint in any of these functions, double-click on the large list box at the left side of the dialog box. Note that this enables you to set a breakpoint at any function, even those library functions where there is no source file associated with them. For instance, to set a breakpoint in the library function ‘printf’, double-click on its name. This is the only way to specify a breakpoint in these functions. F2 will not work here because there is no source file associated with that function.
You can specify a source file and a line in the “New breakpoint” edit field. This is enabled only when the debugger is active.
To specify a breakpoint that will be skipped <n> times before it stops the program under debug, double-click on the breakpoint you want to modify. Then enter the number of times to skip in the dialog box that pops up. This feature is active only when the debugger is running, and the settings will not be saved between debugging sessions.
Displaying
Information about the
Program
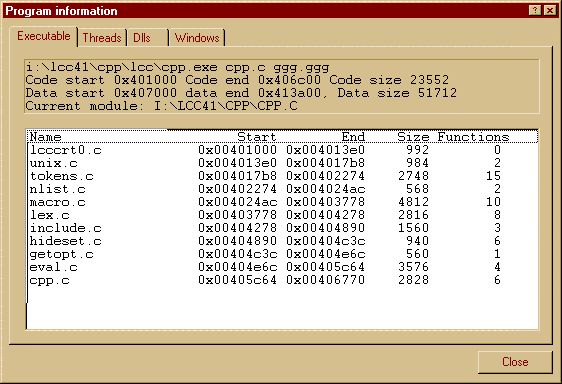
This can be reached using the ‘Info’ menu item of the debugger menu. It appears in the form of a tab control, displaying information about the executable, its size, etc., as well as the threads that the program has created, the loaded DLLs, and the windows that belong to the executable that is running. This can be useful for pinpointing where a problem occurs.
Note that in the threads display, you can choose among different running threads and start/stop it by double-clicking in the display line.
CPU
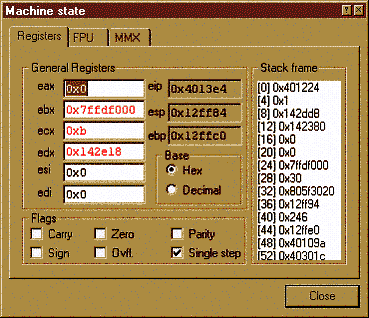
This menu option in the debugger menu will open/close the machine state property sheet. This allows you to see the contents of the machine registers. You cannot currently modify the register contents. This option should be available in the future.
The first set of registers shown is the integer register set:
|
|
· Six integer registers (eax, ebx ecx, edx, esi and edi) · Flags. Since the debugger sets the machine in single stepping, that flag is always on. · Three system registers: the program counter (eip), the stack pointer esp, and the frame pointer ebp. · Display of the stack frame, at right. You can change the base for displaying numbers with the radio buttons ‘Hex’ or ‘Decimal’. |
The second set of machine registers are the FPU registers and their associated flags.
|
|
The 8 FPU registers are shown at the left. At the upper right, the tag word is displayed. The top of stack (TOS) is shown in a read only entry field. Status flags of the FPU (C0-C3) and the other flags are shown in the two columns of checkboxes below. |
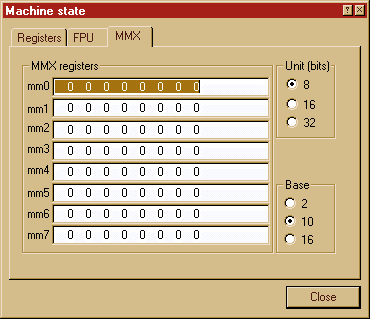
The third set of registers is the mmx registers. Use this set only if you use the MMX intrinsics and your machine is an MMX machine.
|
|
Using the ‘Units’ button at the right, you can change the display from 8 bits, to 16 or 32 bits since each mmx register can have 8 characters as 8 bits quantities, or 4 16-bits words, or two 32-bits double words. Using the ‘Base’ radio buttons, you can display the data either in binary, decimal or hexadecimal form. |
Machine Instructions
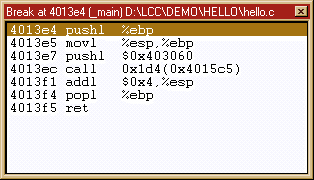
This menu option opens or closes the ‘Code’ display. This will display the assembly codes for the function currently being executed.
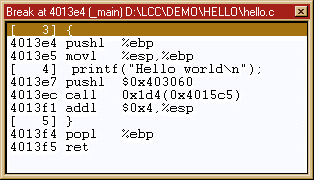
If you click in this window with the right mouse button, a contextual menu will appear that allows you to mix C code with assembly instructions (the ‘Source annotation’ menu option) or display the code bytes, i.e., the exact instructions without decoding by the disassembler. When this window is open, you can reset the program counter to any desired location within this window. Choose the ‘Set next instruction’ menu item from the contextual menu. This menu appears when you click anywhere in this window with the right mouse button.
|
|
The name of the currently active function is shown in the title, its corresponding file, and the machine address where execution has stopped. Next there is a three-column display with the machine codes to the left, followed by the assembler mnemonics in lcc assembler syntax. |
|
|
The C source lines are mixed with the assembly display. The line numbers are in square brackets to the left. |
If you are interested in the exact code bytes that are stored and not just their mnemonics, you can view the hexadecimal numbers shown at the left of the assembler mnemonics.
When the ‘Code’ window is open, the debugger will single step through each assembler instruction instead of single stepping through each line of the source program.
The
Stack Display
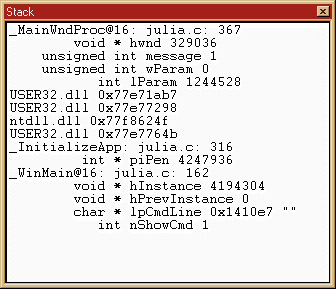
The stack window displays the stack of procedures that are active at a given execution point. It can be activated at any time by clicking in the stack button at the bottom of the editor.
|
|
The ‘_MainWndProc@16’ is the active procedure. Note that symbols are displayed with their decorations as they appear in the executable. The name of the function appears, followed by the source file and line number. The next lines show the argument stack for the procedure with the type of each argument and their values. When the information is not available (i.e., a system DLL), only the machine address where the call up was implemented is shown. |
Note that ‘MainWndProc’ is a callback procedure. You can determine this because USER32.dll and ntdll.dl appear as active in the stack. Note that the user function ‘InitializeApp’ is also active. This is the normal case for processing a WM_CREATE message. When you call up CreateWindow, this function sends a WM_CREATE message to the window procedure before returning to the caller.
You can view the code of any active stack procedure by clicking on the corresponding line. Note that you should click on a function name and not in the parameters. When you click on a function name, the debugger will bring that part of the source code into view.
The
Locals Display
This window will show you the local variables of the function currently being executed.
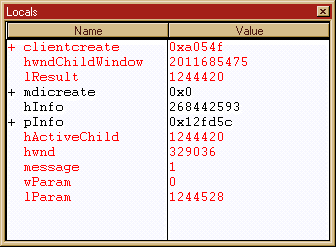
The symbols marked with a ‘+’ are structures, unions or tables, i.e., aggregates.
The
Events Display
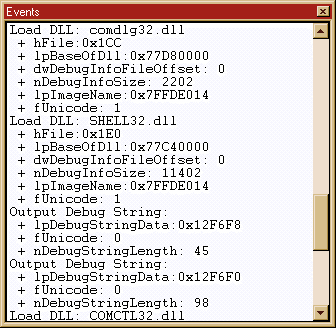
The ‘Events’ window shows you the threads that the program has started, the DLLs that were loaded/unloaded on the program’s behalf, etc.
The debugger will show the output of the ‘OutputDebugString’ Win32 function in this window.
If your message uses the Win32 API function ‘OutputDebugString’, all debug strings will be displayed in this window. Note that this does not trigger a breakpoint.
Here, the exact sequence of actions when a trap occurs will be displayed, if there is a problem with the debugger.
|
|
A DLL is loaded. The debugger displays its name, the file handle for the executable, the base of the DLL code, the offset to the debug information (if any), the pointer to the DLL name, and whether or not it is a Unicode DLL. The OutputDebugString event is received. The debugger is currently unable to understand the undocumented formats that are used by Microsoft’s DLLs. Further investigation of this may produce a more interesting display here. Normally a character string should be at the address pointed to by lpDebugStringData, but this is not the case for system DLLs. |
The
Memory Window
The memory window allows you to explore the contents of memory at a specified address or variable name.
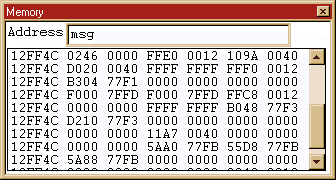
A contextual menu opens with the right mouse button that allows you to modify the display format. You can use bytes, shorts, or longs as units.
If you enter a symbol name, that symbol should be either global or in the active scope.
The
Watch Window
This window allows you to open a secondary watch window where the contents of a variable can be displayed permanently. The debugger will evaluate the contents of the field at each stop.
A box opens asking you which variable you want to watch. Enter the name of a watch and press return.
To erase a variable from the watch list, press the ‘delete’ key. To add a variable, press the ‘insert’ key. Remember to first click in the watch window so that it receives the focus. As of this release, only simple types are supported, i.e., if you have a structure with an integer field, type struct->field into the watch window input.
The watch window looks like many other windows in the debugger:
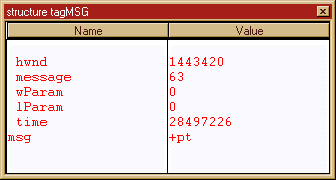
Each field of the ‘msg’ structure is
displayed.
Each time the debugger stops, it will update this window with the current values. This allows you to follow the evolution of the values during program execution.
The
‘Auto’ Window
This window tries to display the values that may be of interest from each line of the source code that is currently being executed.
For instance, for the following source lines:
|
|
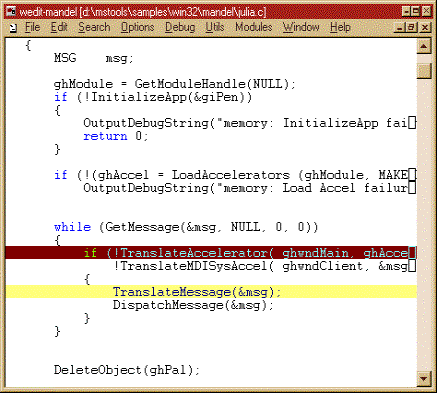
Here execution is suspended in the ‘TranslateMessage’ source line (shown in yellow). There is a breakpoint three lines earlier. |
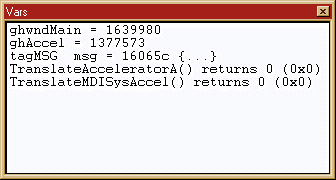
At this stop in execution, the variable window will display the following:
|
|
· The value of ghwndMain is shown · The value of ghAccel is shown · The structure tagMsg has the address 0x16065c. Aggregate values are not shown and are only displayed as {...} · The function results are indicated by ‘returns’ and a symbol followed by a (). |
The preceding line and the current lines are scanned for identifiers, and the values of all such identifiers are displayed. In addition, the return values of all functions called are shown. This is very simple: Wedit’s debugger scans the current line and the preceding line, eliminates comments and character strings from them, and scans all identifiers that it can find. The debugger and the results shown evaluate this list. In addition, each time a function call is found, its results will be stored and displayed in the ‘Auto’ window.
Evaluating
an Expression
You can reach this option through the ‘Evaluate symbol’ option of the debugger menu. This option leads to a dialog box that prompts you for an expression to evaluate and displays the results in a list box, below the input combo box.
It is simple to use: Type the expression to evaluate in the combo box line and the result is displayed below. In principle, all symbols in your program should be available for display. In practice, there could be some problems. See below for further information.
Setting Data Breakpoints
Wedit can stop the program when an address is accessed, either in read or in read/write mode . To enable these special breakpoints, you should choose the ‘Data breakpoints’ option in the debugger menu.
You have up to four data breakpoints (there are only 4 debug registers in the x86 architecture). Enter an address expression or the name of a variable, the size of the variable (only 1,2,or 4 are possible), and the access type. Whether the breakpoint should fire when the variable is accessed (read access) or when the variable is written to (read/write access).
When the breakpoint fires, Wedit will stop the program and display the closest location to the breakpoint in the program. Note that data breakpoints fire after the instruction is executed. If the access is in read/write, Wedit will display the old and the new variable values.
Calling Up the Debugger
if your Program Crashes
If you have set the debug level higher than 2, the compiler will present a dialog box with the option of calling up the debugger if a program crash occurs. You just press the ‘Cancel’ button, and Wedit will be called up with the context of the crash. You can browse the variables in the procedure that crashed, and (if possible) you can restart the program at a different line in the same function.
The debugger
configuration tab
You can set several parameter in the debugger configuration tab of Wedit. You can :
·
Set the number
base (10 or 16) to display integers either in hexadecimal or in decimal
notation.
·
Set the name and
the arguments to be passed to the program that you will debug. Note that this
command line will be executed when you just execute the program with Ctrl+F5.
·
Set the initial
directory where the program will be started.
Debugging
Windows Programs
It is important when you debug windowed programs that the debugger not interfere with the window of the program being debugged. Any interference of the debugger with your program’s window will trigger a message to your program, which could cause procedures to be called up that will change the execution of the program. For instance, if you try to debug the procedure that is called up when a WM_PAINT message is received, the fact that the debugger will pop up and hide a portion of your program’s window, will trigger the function you want to debug to be called up again. If you have a breakpoint in it, there is no way to escape an endless cascade of the same message. This can be stopped either by erasing the breakpoint or by moving the window so that the debugger’s window does not touch the window of your program.
The Profiler
The profiler is a utility that allows you to see where your program is spending its time. It operates by starting a special debugging session in which the debugger interrupts the running program approx. 1,000 times per second. When the debugger stops the program, it checks what the program is currently executing and records each source line/function that corresponds to the current program counter (EIP).
When the program finishes running, the debugger assembles the information it has gathered into a report in which each function that was interrupted is shown with the number of hits it had.
The logic behind this method is that the longer a function executes the higher the probability that the debugger will interrupt its execution. Since this is a statistical approach, the longer the program runs, the more accurate the information of the profiler will be. Short runs can introduce errors because the chance factor is higher. Longer runs provide a more reliable report.
When measuring a program’s execution, you should run several profile sessions before using the data.
To start a profiler session, you should compile the program with the debug information ON of course. Use only the lowest debug level (g2). Other debug levels will introduce a skew in the data, since they affect the program’s runtime behavior. For instance, if you set the debug level to g3, at each procedure call, the program will record the name of the procedure in the stack, making procedure calls more costly, skewing the data seen by the profiler.
The profiler report will be loaded automatically into the editor. You can save it or rename it as you would do with any other text file.
During the profiler session, the debugger’s main window will appear. Do not use it because the profiler session could be stopped or slowed down, rendering the data useless.
Configuring the Compiler and the Linker in Wedit
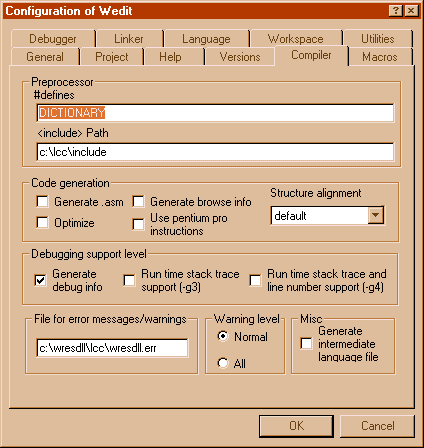
The compiler can be configured using the following tab:
|
|
In the first line, under ‘Preprocessor’, enter the symbols you want to define for all compilation units. Wedit will append a –D to each definition that should be separated by commas or spaces and pass these options on to the compiler.
For code generation, you can:
·Generate the assembler listing of each source.
·Turn optimizations on or off.
·Generate the browsing information always when compiling. This is not very productive, since Wedit will generate this information on an ‘as needed’ basis. Setting this option will slow your compilation, but may speed up later searches.
·Use Pentium Pro instructions
or not. Note that if you check this button, the compiler will generate a
program that will not run in a machine that does not have these instructions,
for example, an old 486.
·Set the structure alignment space. This is the space that the compiler leaves free between members of a structure to speed up their access.
· The debug options See the corresponding command line options g2-g4.
· The file for error messages and warnings will be used internally by Wedit. This is displayed here for informational purposes and can be changed, but it is not recommended. If you want to save the messages of a compilation, you can copy this file to another site.
· The warning level options.
· The ‘Misc’ entry, with the option to generate the intermediate file is only intended for studying the compiler itself. It will produce a .lil (Lcc Intermediate Language) file for each compilation unit .
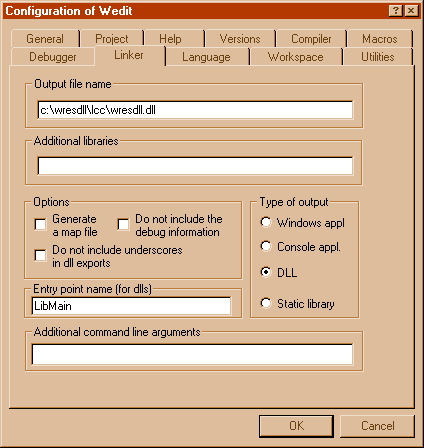
The linker can be configured with the following tab:
|
|
·You
can change the name of the output file, for instance, to place your binaries in
different directory, instead of the default directory.
·You
can change the type of executable generated (Exe, Dll, or other)
·In
the additional libraries tab, enter any libraries that are not included by the
linker as a default.
·The
“Options” group:
o You can instruct lcclnk to generate a map file with the addresses of all symbols used by your program by checking the corresponding box. If you are building the executable to be shipped and are concerned about its size, you can instruct the linker to strip all debug information from the executable.
o Some DLLs that are going to be used by language processors other than C do not support the preceding underscore in the export table. The corresponding option allows you to set this feature for use, for instance, by Visual Basic. Remember that if you load this type of library dynamically, use a name without underscores!
For simplicity’s sake, not all the linker options are displayed in this tab. You can read the lcclnk command options for the command line at the beginning of this document and add any option you consider useful in the corresponding edit field at the bottom of this tab.
Other utilities
The Binary Editor
This sub-system allows you to visualize a file in binary mode. The bytes in the file are displayed without taking into account any line records.
You reach this utility from the File -> open binary menu option.
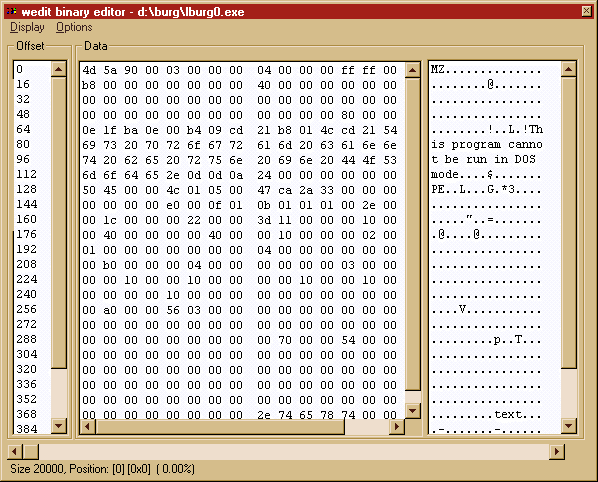
The display is organized in three main blocks:
The offset of the data within the file in the left column
The 16 bytes that follow that offset displayed according to the settings of the 'Style' button
Their character representation (if any)
The Menu Options of the
Binary Editor
Style
This option allows you to change the representation of the data in the column at the center of the display.
|
|
You reach this dialog box by using the ‘Style’
option in the binary editor ‘File’ menu. The representation formats available are: Characters shown in hex Integer 8 bits shown in decimal Integer 16 bits, unsigned or signed Integer 32 bits, unsigned or signed Bit inverted. The bits 0-31 become bits 31-0 Float simple precision (32 bits) Float double precision (64 bits) |
You can choose any of the representations above.
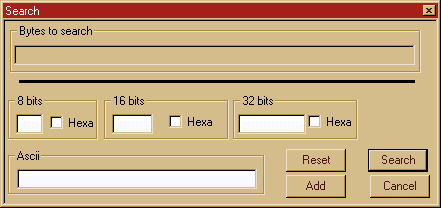
Search
This option allows you to search either an integer or an ASCII character string.
|
|
You reach this dialog box by choosing ‘Search’ in the
‘Edit’ menu bar of the binary editor window. |
It is possible to specify the following data types:
Integers (8, 16, or 32 bits)
Character strings
· ASCII
To add to the search byte sequence, enter your data in one of the fields and press the ‘Add’ button.
For instance, if you want to search for the binary integer 47234 followed by the ASCII sequence « foo » you would enter the number 47234 in the 32 bits field, press the ‘Add’ button, and then write « foo » in the ‘ASCII’ entry field followed by ‘Add’ again. In this way, you can easily specify very complex search sequences.
The sequence of bytes that will be searched for is shown at the top in the read only entry field ‘Bytes to search’.
Goto
This option will move the current point to the specified position. You can move the cursor using the arrow keys or the page up / page down keys. Within the small ’goto’ dialog box, you can enter the file offset either in decimal or hexadecimal form.
Structures
This option allows you to apply a data structure to the bytes at the current offset. Data structure means, in this context, a series of field descriptions composed from the elementary types and possibly a length. The building of that structure is done with a screen having the following sections:
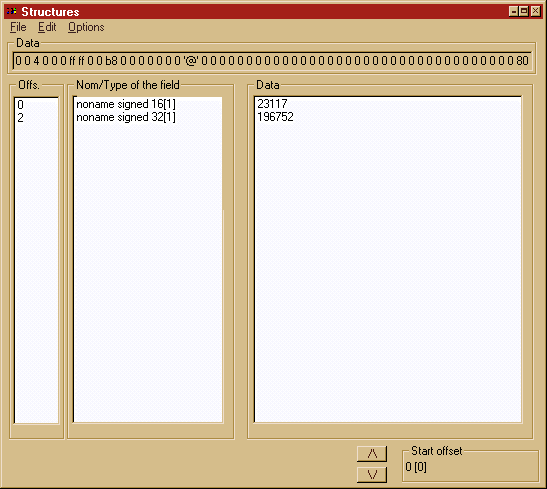
A column at the left indicating the offset of each field relative to the beginning of the structure.
A 'Type' column that indicates the length and the representation used for this field.
The data for this field. Note that only the first few characters are shown.
You can display the data either in decimal or hexadecimal form.
To add a field to the structure proceed as follows:
1. Choose the 'Add' menu option. This will open the following dialog box.
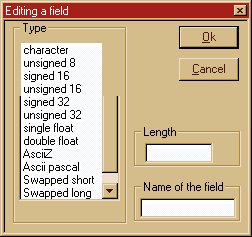
2. Define the base type of the new field by clicking in the available primitive type list on the left.
3. Define its length if it is different than one.
4. Give it a name if you choose to.
The primitive types that are available are:
Characters
Integer 8 bits
Integer 16 bits, signed or unsigned
Integer 32 bits, signed or unsigned
Float simple precision (32 bits)
Float double precision (64 bits)
ASCIIZ: Character string finished by a zero
ASCII Pascal. Character string with a length byte at the beginning.
Swapped short: Short integer coming from a machine with inverted byte order.
Swapped long. 32 bit integer coming from another machine.
Bit inverted. The bits 0-31 become bits 31-0.
To erase a field from the structure definition:
1. Select a field by clicking on the list.
2.Choose the 'Erase' menu option.
The Software Metrics Module
In this context, software metrics means a set of measurements made of the source code of your program to determine certain metrics or ratios. This is a domain with a long story of continuous refinement of the definitions and metrics involved that would be impossible to describe in the context of a software manual. It is this author’s personal opinion, however, that this field has lacked the raw data from numerous measurements by many people. With this idea in mind, Wedit tries to provide you with a set of tools to measure your code and deduce your own conclusions. The emphasis is on providing raw data and displaying it without any interpretation; the objective being that you interpret the measurements as you like. Important here are not the actual numbers displayed, but the experience you accumulate by investigating your own code and seeing how those numbers correlate to your experience with the software that you write or maintain.
After reviewing the enormous amount of papers published within this field, the author abstracted the following information, which seems to be widely recognized as meaningful measurements.
The number of lines of a program/module
The number of unique operands
The total number of operands used
The number of unique operators
The total number of operators
The number of flow control statements
The volume of commentaries
For the C language, Wedit considers the expression "++" or "+=" as an operator. Constants and variables are considered as operands (the objects that operators manipulate). A construct such as 'while' or 'for' is considered to be a control flow directive.
Analysis of a Whole File
This option provides a global view of the functions in a file, displaying the results in a graphical form. You can call up this option by clicking somewhere in an open file with the right mouse button. In the contextual menu that opens, choose the ‘metrics’ menu option.
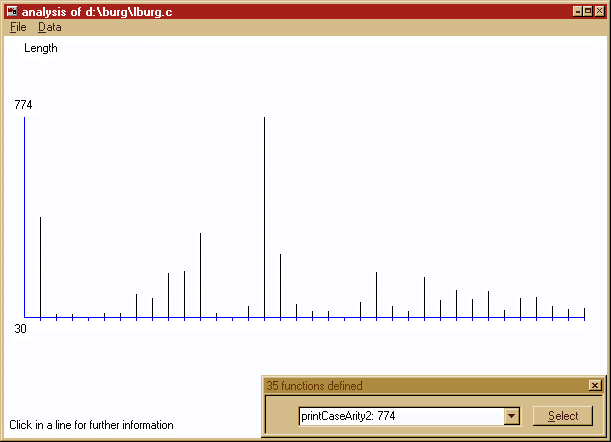
A line whose length is proportional to its length or volume, depending on the settings of the ‘Data’ menu selection represents each function in the file. To see to which function each line corresponds to, click on the line you are interested in. In the dialog box (at the bottom of the graphic), this will display the exact value of the line and the name of the function to which it corresponds. If you select it in the dialog box, all the data corresponding to the data will be shown.
The result is displayed in the following dialog box:
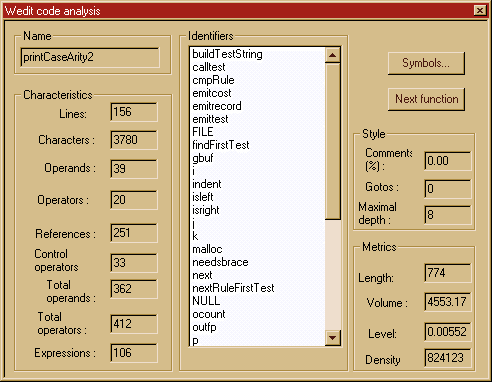
There are four
main groups of collected data:
The group to the left shows the raw
data.
The 'Style' group shows the
percentage of comments, etc.
The 'metrics' groups show the values
calculated according to the formulae below.
The 'Identifiers' list appears as
information only.
The formulae used
are:
LENGTH: Total
number of operators + total number of operands
VOLUME: Length *
(log(number of unique operands)/log(2) )
LEVEL: (2 / unique operands) * (unique operands /
total number of operands)
DENSITY: VOLUME /
LEVEL
These formulae correspond to Halstead’s work.
How Wedit Collects the
Data
It is not necessary in this forum to discuss at length what a line of code is. Defining the nature of an instruction, is slightly more complicated. For the C language, Wedit uses the number of statement separators (the semi-colon) as a guide. The other definitions are straightforward: All operators are counted for the number of possible operators, including the preprocessor commands. The rationale behind this is that they count for the comprehension of the text. Parentheses are counted each as an operator.
Numbers are considered operands, as well as static character constants or strings. The flow-control operations such as, 'for case while', etc. are counted, and they are important for the McCabe complexity measurement.
The 'style' group gives the percentage of comments, the number of 'goto' instructions used, and the maximum depth of blocks in the analyzed code.
![]()
Analysis of a Function's Identifiers
If the number of lines of a function is
important, it can be difficult to see the evolution of a variable usage. This
utility builds 'cuts' through the program text, showing you a reduced number of
lines: those that contain the identifier that you want to investigate.
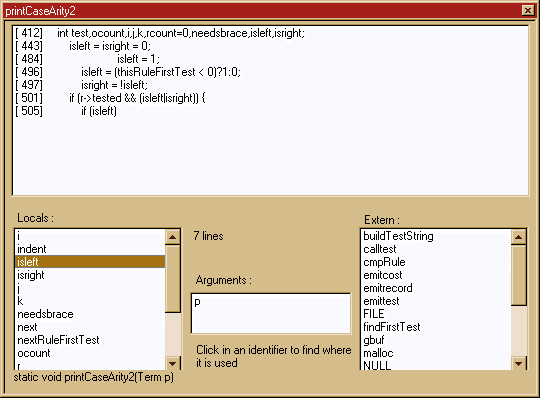
This option allows you to visualize only the lines of the function that contain the given identifier. It is designed to show more clearly the evolution of the contents of a variable and to easily identify if there is a problem. If the first line does not contain an assignment statement, for instance, it is likely that an uninitialized variable problem exists. The variables are classified in three groups:
Local
variables (left column)
Arguments
(center)
External
symbols (right)
An external
symbol in this context means all the identifiers that are not defined as locals
or arguments. This includes the #define statements that the function uses and
the names of all typedefs used. This does not correspond to a strict C external
definition, but rather to the importation of names and to the dependencies
created by this importation.
It is simple to
use: click on the symbol that you want to investigate and all affected lines
will be shown at the top of the three lists.
At the lower left
you will find the function's prototype.
The Macros
The key combinations Ctrl+Shift+A to Ctrl+Shift+Z are reserved for 26 different macros. Macros are simply long phrases that you can define to be inserted at the cursor's position when you press the specified key combination. For instance, you can define a macro Ctrl+Shift+I for the 'if' construct of the C language:
if ( ) {
}
else {
}
To enter/modify a macro, use the 'Macros' option from the
'Edit' menu. This option will display the following dialog box:
|
|
You
can reach this dialog box by selecting the ‘Macros’ tab in the configuration
property sheet of lcc-win32. |
In the left column, the key that corresponds to the macro name is visible. The replacement text is shown at the center. The 'Add' button adds a new definition, the 'Erase’ button deletes a definition.
Identifying an Executable or an Object File
This option allows you to insert a static character string within the C source file of type: ''$keyword:value$''. Since the static character strings are included in the executable, this will allow the 'Identify file' utility of the 'Find' menu to search for all of these types of character strings within the executable to identify the name and the date of each module that was used to build the final product. The editor recognizes the static character string and updates the date automatically each time a module is saved.
|
|
You
reach this dialog box by choosing the ‘ID’ option in the ‘Search’ menu bar. |
Normally you would leave the entry field empty. You can, however, use it to add additional information to the file. Take into consideration space restrictions, since these character strings use space within your executable image.
To inspect an executable, use the 'Identify file' option of the 'Search' menu. This option will display the following dialog box:
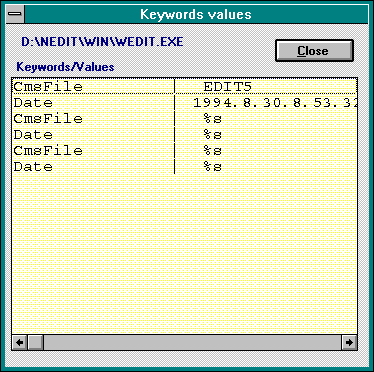
An executable can contain many of these character strings, each one from a different module of the system. This allows you to see each of the sources that were used to build the final product. This can provide significant assistance in rebuilding the state of the sources to find a problem at a client's site.
Generating a Table of Character Strings
Wedit allows you to automatically generate string tables, either in the .rc format, or in a plain table format. All of your current C source files will be scanned for character strings.
The basic idea is to replace all occurrences of
ShowError("File not found");
by
ShowError(GetRcString(354));
or
ShowError(StringTable[354]);
This
- Simplifies the translation of your software into another language
- Separates programming from the writing of error messages
- Reduces the total size of the program in memory because the character strings use memory only when they are used and total memory size of your executable diminishes.
|
|
|
You can reach this dialog box by choosing the ‘Strings’ item in the ‘Utils’ menu bar. |
This dialog box allows you to view and control the generation process.
'Renum' option
This option allows you to renumber the integers used for identifying each string. If you want to include the strings in another table, this option is essential.
The following dialog box is displayed:
Here you can change either the starting number or the increment to be added to each string. If you want to have one numeric identifier for a string altering the sequence, go to the 'Edit' option below.
'Edit' option
This option is active only when a character string is selected. It will change the configuration for a particular character string. You can change the number or the symbolic name you will use for the string that is selected.

Exclude:
If you do not want to include a character string and leave it this way in the source, select the string and press the exclude button.
![]()
You have two options for generating the string table. The first is to generate it in the STRINGTABLE rc format; the second is to generate it in a normal character string table.
The generation of a string table in the .rc format leads to the following dialog box:
|
|
You
reach this dialog box when you click the ‘rc’ button in the ‘Strings’ dialog
box. You reach the ‘Strings’ dialog box by selecting the ‘Strings’ menu item
in the ‘Utils’ menu bar. |
You should enter:
The name of the output file
The name of the function that will return a character string at runtime
If you want to have the symbolic names (#defines) or the numbers in your source file
The resulting file looks like this:
STRINGTABLE
BEGIN
STR_0000,"Aucun"
STR_0001,"Champ
<libellé> est obligatoire"
STR_0002,"Champ <nom>
est obligatoire"
STR_0003,"*"
...
STR_0034," "
STR_0035,"%7d "
STR_0036," -- "
END
In the source file, instead of (for example):
sprintf(msg,"%s
exists already",tamponalloc);
We have
sprintf(msg,GetStringFromRc(STR_0008),tamponalloc);
/*
%s exists already */
The generation
of a table is functionally equivalent.
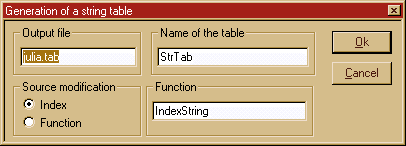
You enter:
1. The name of the output file. If this file
exists already and it is a table string file that was previously generated by
Wedit, the new definitions will be appended to the end of the file. Automatic
renumeration will occur to avoid destroying the definitions of previously
existing strings.
2. The ‘Name of the table’ entry field is the
variable name that will be used in your program text to access this table. You
should use names that avoid conflicts with any other identifier in your
program.
Alternatively,
you can name a function that will return the character string given an index. This
option is active if you choose the ‘Function’ radio button at the left. If not
a straight index will be used.
The "DIFF" Utility
This
utility will find the differences between two text files or between all files
of two different directories.
|
|
You
can reach this dialog box by using the ‘Diff’ option from the ‘Utils’ menu Alt+u, then d. |
The
entry fields should contain the names of the files to compare. The options are
self-explanatory. Only the 'C' syntax option needs further explanation. This option
will preprocess both files, ignoring comments and all white space, and report
any differences in the program text. The result will be organized by function
changed. This allows you to quickly determine which functions were changed
between two files.
If
both names are directory names, DIFF will search all files that match the
specifications in both directories and present a summary of this form:
If
you want to use the ‘merge’ utility, you should check the corresponding check
box, and fill in the name of the output file, since the merge will create one.
If
you press 'Detail' button, DIFF will compare each of the common files in both
directories.
The 'Ignore' button allows you to exclude
from the list of common files the selected file.
The
differences between two files are presented this way:
|
|
You
reach this dialog box when you make a DIFF between two directories or several
files at once. |

![]()
You can go to the next/previous difference using the push buttons at the bottom of the display.
This dialog box is not modal and can be left open during the modifications that you make to a file.

If the option 'C syntax' is selected, Wedit will show the differences in this dialog box:

At the upper left, there is a list of all modified functions; at the lower left, a list of all global modifications, i.e., all modifications that are not within a local scope. By selecting a line from one of these list boxes, you will see the difference shown in the two multi-line entry fields at the right.
Adding a Utility
A utility is a program launched by the editor using a menu item from the 'Utilities' tab in the configuration of Wedit. It should be a program that you use frequently. The 'nickname' you choose for it will be added to the 'Options' menu.
|
|
The dialog box asks you for the following information:
The name of the executable to start. Here you should enter the name of the executable or a keyword enclosed in dollar signs.
The arguments you want to pass to the program
The directory in which the program should start
The nickname you want to associate with the program. This name will be added to the options menu.
You can enter the following keywords, instead of a 'hardwired' argument:
$EXE$ This will be replaced by the executable that is associated to the current project.
$FILE$ This will be replaced by the name of the current file.
$CURSOR$ The symbol under the cursor.
$ASK$ The editor will ask the argument of a program and replace the keyword with the text you enter.
Inserting Special Commentaries
Commentaries are important. Wedit helps you standardize two kinds of commentaries: Those that precede a function definition, which help to clarify what the function does, and those commentaries at the beginning of a module, which describe the contents of the whole module.
|
|
|
|
You reach this dialog box either by using the ‘Description’ sub-menu in the ‘Edit’ menu bar, choosing the ‘’File’ option, or using the contextual menu that opens when you click with the right mouse button somewhere within an open source file. |
|
The different
fields should contain the following information:
"Name": The name of the file. This field is filled in automatically by Wedit.
"Identification": This should be filled in with the user. No control whatever is done on the data entered here.
"Description": Idem.
Inserting a Comment at the Beginning of a Function
To use this function, place the cursor at the beginning of a function and choose the Edit->Description->Function option from the menu. This will produce the display of the following dialog box:
|
|
|
You
can reach this dialog box by using the ‘Function’ sub-menu of the
‘Description’ option in the ‘Edit’ menu bar. Or you can go to the ‘Edit’ menu
bar, choose ‘Description’, then ‘Function’. |
If you fill in the fields and Wedit cannot verify the information you type, the prototype of the function is displayed at the bottom. Do not modify the first two fields: They are maintained automatically by the editor.
The ‘Purpose’ field is for a general description of the function algorithm and any general notes that are necessary for understanding how the function works.
The ‘Inputs’ field is for commenting on the argument that the function receives and any global variables it uses.
The ‘Output’ field is for documenting the return result and any modifications the function makes to its global environment.
The ‘Error handling’ field is for documenting what happens in the event of an error, including what error checks are run, etc.
These special comments would not be useful if they could not be modified. The editor recognizes these types of comments and will parse its contents and display them if you choose this option again and there is already a special comment similar to this.
The 'TREE' Utility
This option graphically displays the calling tree of a function. It can be reached through the ‘Utils’ -> analysis -> Tree menu options. You will be prompted for a function name. That function will be considered the root of the hierarchy.
Here is an example of the graphics displayed.

The small menu at the left allows you to print the tree or to show information about it, such as depth, number of branches, etc.
The Object File
Cross-Reference Utility
This utility allows you to search for symbols or view the dependencies between two modules by using the object files themselves as a source of information. This utility is based on a similar utility that Borland included in their TURBOC compiler environment for Windows 3.1.
One of the main points is showing you which functions in your code aren’t used anywhere. This can be viewed easily with the “Unreferenced publics” list, described below.
The first step when using this utility is to choose the object files that you want to include in the cross-reference.
|
|
You
reach this point by using the ‘Analysis’ option in the main menu, and then
choosing Cross-reference object files: ‘obj’. To
add a file, select it in the list, then press ‘Add’. To eliminate a
file, select it in the list below,
then select ‘Eliminate’. To
quickly select all files, select the first file, then simultaneously press
the Shift + down arrow keys. The
directory in which the files are located is shown at the bottom left corner
of the dialog box. |
You can change the directory using its corresponding button at the bottom, eliminate object files with the “Ignore” button in the middle. When you are finished, press the ‘OK’ button. The following dialog box will appear. This may take some time, because all of the actions are implemented after you press ‘OK’.
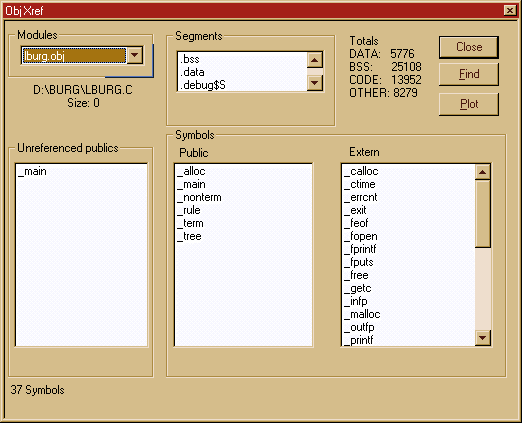
The main point of interest in this dialog box is the left column. It will indicate to you which symbols are exported from a module and not used anywhere else in the program. Either these symbols are used in the same module and should be declared static rather than public, or they are not referenced anywhere and are dead codes that can be eliminated. The latter is the more likely. Of course, as in the example above, the ‘main’ function is an exception!!
You can choose a module to display using the combo box at the upper left corner. It is possible to find a symbol (press the ‘Find’ button) or display the results in a graphical display. Press the PLOT button.
The plot arranges the object files in a circle, and will indicate the relationships between any two points in the circle with colored lines. Those lines show you what is imported/exported between two modules.
By clicking on a line, you will see what symbols are exported/imported from the two modules. This is similar to the ‘relationships’ utility, but different in that there is no symbolic processing. When two modules share between them a macro definition, for instance, this will not appear here.
Here is an example of the PLOT output.
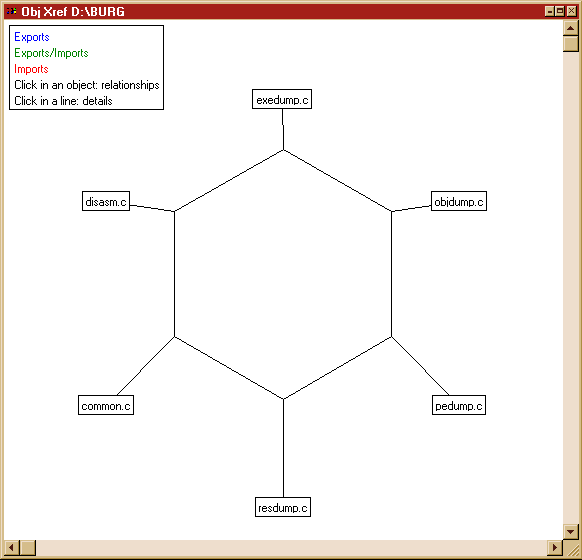
This plot shows six object files. The color codes are shown at the upper left corner. By clicking in the file name ‘exedump.c’, the display changes and two green lines originate at ‘exedump.c’ going to the other modules where there is a relationship. By clicking in those lines, you can display in full all of the symbols that tie those modules together at the object file level.
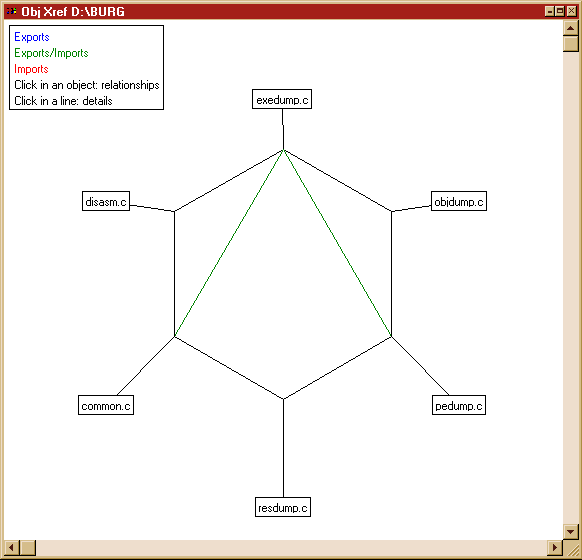
Searching Information about the Defined Functions
The editor can search for the following types of information: Function prototypes and function relationships, i.e., what calls what and where.
|
|
You
can reach this dialog box by selecting the Browse functions item in
the ‘Analysis’ list box. The
‘Analysis’ list box can be reached from the main menu by selecting ‘Utils’
then ‘Analysis’. |
All information shown is based on the currently selected function, which is highlighted in the function listbox at the upper left. Each time the selection of that listbox changes, the information in the other parts of the dialog box will be updated accordingly.
For each function, the following will be displayed:
Its prototype at the bottom and any commentary that immediately precedes the function definition
All functions that call up the selected function in the list box at the right
The name of the file and line number where the function is defined
All functions that are called up by the selected function in the list box at the middle of the dialog box
Double-clicking in one of the list boxes will call up a dialog box showing the exact place where the call is done and its context.
Writing the Prototype of all Functions Defined
in the Current File
The 'Prototypes’ option is used to produce a file of prototypes that will describe all functions defined in the current file. It is better if this is handled automatically so that a function prototype is not forgotten and older software is converted to the ANSI form.
|
|
You
can reach this dialog box by using the ‘Analysis’ option from the ‘Utils’ menu,
then choosing the ‘Generate the function prototypes’ item in the list box. Click
on ‘Utils’ then ‘Analysis’. A list
box full of option appears. Choose the ‘Generate function prototypes’ option
by double-clicking on the line. |
|
Output file name |
You should enter the name of the output file here. If that file name is in use already, you will be prompted before the editor replaces it. |
|
Options |
The button 'Load into the editor' will display the result after build. For more information see the browsegen documentation |
The structure of the generated file is the following:
A commentary with the name of the source file and the date of generation
A preprocessor instruction to avoid including this file twice
The prototypes for each function defined in the source file
An #endif at the end of the file
For example if the source file is called FOO.C and the name used for the generated .H file is FOO.H, the generated file will have the following form:
/* Prototypes for
C:\TST\FIC.C. Generated 1994.06.19.6.6.26 */
#ifndef TFIC_H_ID
#define TFIC_H_ID
int FindLineFromPoint (int
ycoord );
HRGN BuildRegionUp (HPS
hPS ,int lin ,int col );
...
#endif
Searching and Displaying a Structure Definition
The editor will display the definition of any structure defined within the current file or any file #included in the current file. To use this option:
Place the cursor under the name of the structure you want to display
Press F8.
The editor will open a secondary window containing the definition of the structure.
Similarly, if the cursor points to a symbol of a type structure, F8 will display the definition of the symbol AND the definition of the structure. The newly opened window can be reached with Ctrl+Esc.
Alternatively, you can point the cursor arrow at the name you want to search and choose the option to go to the definition from the contextual menu that appears.
Showing the Definition of
all Defined Structures
This option is part of the ‘Analysis’ menu item in the
‘Utils’ menu bar. It allows you to browse the definitions of all defined
structures in all loaded files. The editor assumes that the definitions of
structures are common to all loaded files.
Before parsing the current file, the editor asks which include directive should be followed. As you know, in C there are global includes (enclosed in angle brackets) and the local includes, enclosed within quotes. Choose only the local includes if you want to focus your search on the structures defined by you, without taking into consideration the system structures, which can be numerous and may not relevant to your search.
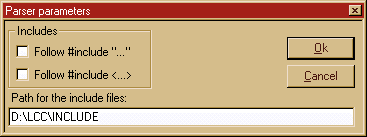
The information is presented as follows:
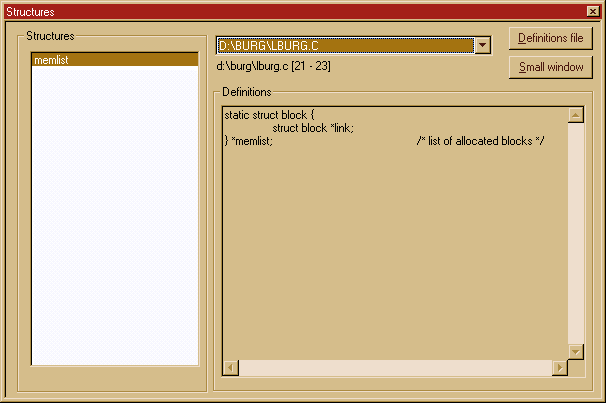
The information displayed depends on the selection in the list box to the left.
The 'Print' button will generate a memory file in the editor with the definitions of all the structures in alphabetic order. You can print it using the normal printing procedure of Wedit. The name of the buffer is '_struct_.c'.
The 'Small window' button will open a secondary window with the structure definition.
Show Information about the Global Variables
This option allows you to browse the definitions of all the global variables defined in a given module. A global variable for the parser of the editor is any symbol that is defined or used at the global scope (bracket level 0) and is not enclosed within parentheses.[9]
The usage is very similar to all other list-displaying operations. Select one item from the list with the mouse, and the associated information will be updated accordingly.

Showing the Relationships between Two Modules
This option is designed to answer questions such as 'Which functions/Variables are used by module X and defined in module Y?’
First, choose the two modules by clicking on their names in the dialog box that presents you a list of names.
Their relationships are described with the following display:
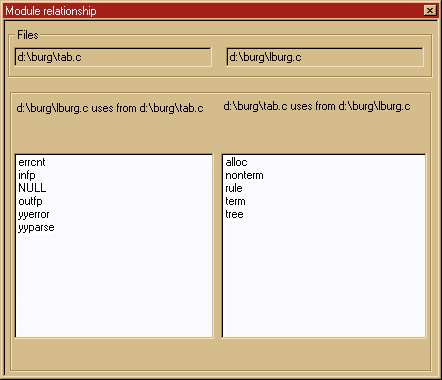
It is important to keep in mind that the search is made at a symbolic level, i.e., if two modules share a preprocessor macro, it will be listed.
Showing the
Executable or Object File Statistics
In the 'Utils' menu, you will find the option 'Executable statistics'. This option calls up the 'pedump' utility and shows the results in the output window. Normally, the file displayed will be the executable of the current project. If there is no project defined, this option will prompt you for an executable file name.
To display statistics for an object file, use the 'File' and 'Open' options, then open an object file. Wedit will call pedump for the corresponding file. The other extensions recognized are 'OCX' for special VBASIC executables, and 'LIB' for library files. In the latter case, Wedit will display the symbols exported from the library.
The output of this utility for an object file is:
Summary of "COMMON.OBJ":
96549 bytes
Time stamp: Mon Feb 08 00:01:20 1999
Section Name Size
01 .text 13188
02 .data 13676
03 .bss 138
04 .debug$S 12044
05 .debug$T 7465
The code section is traditionally called
'Text', even if its contents are not anything that remotely resembles normal
text. The uninitialized data section is also called 'bss' for the same obscure
historical reasons. The 'debug$S' and 'debug$T' sections are the debug symbols
and debug types information.
Automatically Generating the Program's Technical Documentation
This utility proceeds in several steps. The first is to decide which files should be included in the technical documentation. Use only .C files.
|
|
You
can reach this dialog box by selecting the ‘Generate HLP item’ in the ‘Utils’
menu bar. |
The 'Title' entry field should contain the title that will appear in the help file being generated.
The 'Help file name' field should contain a file name with the .HLP extension. The result from compiling an intermediate RTF file (for Windows) or IPF file (for OS2) generated by Wedit will be stored here.
To add a file to the list, click on the 'Add' button; to delete a file from the list, use the 'Remove' button.
The Output File
The generated file has two main levels:
A file level, where the index will show all the C sources included during the compilation. If the file, as is often the case, begins with a commentary, this comment will be included here. At this level, you will find all of this file’s global variables, as well as all variables declared as 'extern'. In general, all symbol definitions (excluding preprocessor symbols) appearing at global level will be here.
A function level, where each function defined in the file is listed, with any comment that immediately precedes the function. This includes, of course, the special editor maintained commentaries.
A 'data structures' level, where all structures defined in the source files and their associated include files are listed. Wedit assumes that the files are related and does not list two structures that have the same name.
Printing Your Files
You can reach this dialog box by selecting the ‘Print’ option in the ‘File’ menu bar.
|
|
This dialog box is used to print one or all loaded files. You can change the font or print a function, generate RTF output, add line numbers, etc.
You can print a given function by choosing the corresponding push button.
You can send the printed file to the printer or you can generate an RTF file that can be used later in a text-processing program.
The ‘Configure’ button allows you to set the printer options.
The first time you use this feature, it is worthwhile to spend some time choosing the right font for your printouts, according to your printer and the fonts available.
