
"We've been using Olectra Chart to build a network management application and have found the quality to be rock solid. The advantage for us is the ability to quickly build a powerful interface with minimal investment on our part. The performance is great, and the technical support has been awesome."
Gerry Claflin, R&D Project Manager, Hewlett-Packard
The Ultimate Charting ActiveX Control
Olectra Chart is the only OLE /ActiveX Charting Control powerful enough to meet virtually any charting need. Advanced, easy-to-use 2D and 3D controls are combined with unrivaled performance levels for ultimate charting. Loaded with unique features, Olectra Chart will help you develop sophisticated and robust Windows applications.
- Distinct 2D/3D OCXs and DLLs, 16-bit and 32-bit
Keep your applications smaller and faster - Complete Object-Based API
Easy to program - Powerful Enough to Build Virtually Any Chart
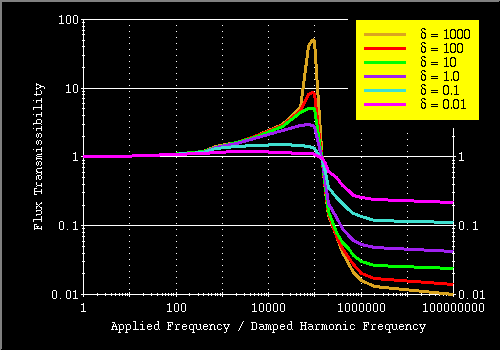
Unlimited charting possibilities, from simple bar charts to complex 3D projections - Built-in Zooming, Scaling, Rotation
Users can dynamically customize views - Fast Updates with Double Buffering
Design scrolling strip charts with real-time updates - Chart Labels and Annotations Anywhere
Unlimited labeling options - Tunable Auto Precision Axis
Auto adjusts axis precision to fit data - Dynamic Time & Date Axis
Axis annotation looks great no matter how windows are resized - Flexible Data Layout
Select regular or irregular data structures - Point-n-Click Interface Available at Development & Run Times
Gives you and your end users maximum charting flexibility
 Olectra
Chart 2D and 3D OCX interfaces are designed for use with visual development
tools that support OCXs like Visual Basic, Visual C++ and Delphi. Additionally,
C developers can access the DLL through a fully documented object-based
C API, or MFC and OWL wrappers. Olectra Chart includes royalty-free runtime
distribution, multiple demos and examples, and complete online and printed
documentation.
Olectra
Chart 2D and 3D OCX interfaces are designed for use with visual development
tools that support OCXs like Visual Basic, Visual C++ and Delphi. Additionally,
C developers can access the DLL through a fully documented object-based
C API, or MFC and OWL wrappers. Olectra Chart includes royalty-free runtime
distribution, multiple demos and examples, and complete online and printed
documentation.
2D
Ultimate
2D Charting

"Olectra Chart is by far
the most complete and
robust charting component
on the market. Software
developers can easily
produce sophisticated charts
in just a few minutes."
Troy Reiber,
Software Engineer,
Decision-Science
Applications, Inc.
- Object-Based Design
- Over 100 objects are included in the 2D Control (axis, legend, etc.).
- Data
- May come from any source, be updated at any time, and be any size. Store data in a grid/array format or in a set of X-Y pairs. Missing values (holes) are also supported.
- Axis
- Defaults for X- and Y-axes minimums, maximums, origins, precision and numbering, ticking and grid increments are all automatically calculated from the data, or they may be specified. Reversed, logarithmic and dual Y-axes are supported. The second Y-axis may have a linear relationship to the first, or may be used to graph a second distinct range of data.
- Time and Date Axis
- Can be used with any 2D chart. Select the date and time format or allow it to automatically adjust at runtime.
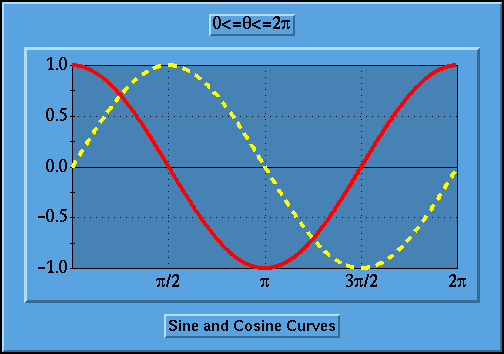
- Line and Point Styles
- Are fully adjustable including sizes, styles and colors.
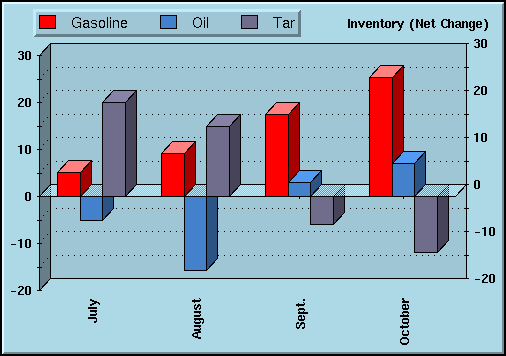
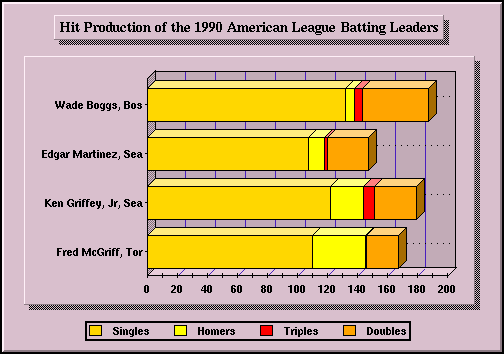
- Bar Charts
- May be horizontal or vertical. Bars may be stacked or in separate clusters. The relative width of the bars and the amount of bar overlap can be adjusted.
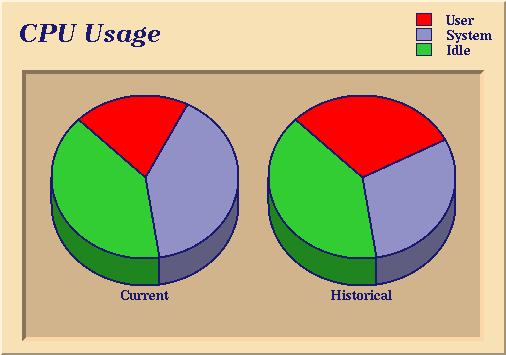
- Pie Charts
- Slices may be any color or fill pattern. Adjust the style and threshold of the pie chart's "other" slice.
- Chart Labels
- Any number of multi-line text areas may be specified and attached anywhere - to data displayed in the graph, or to graph or pixel coordinates.
- Interaction
- Select the built-in zoom and rotation, or turn it off. User interaction methods tell you exactly where the user is pointing so you can design drill-downs.
- 3D-Look
- 2D charts like bar and pie charts can be displayed with a user-adjustable "3D Look".
3D
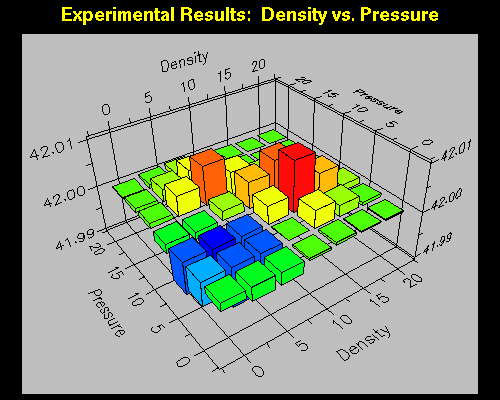
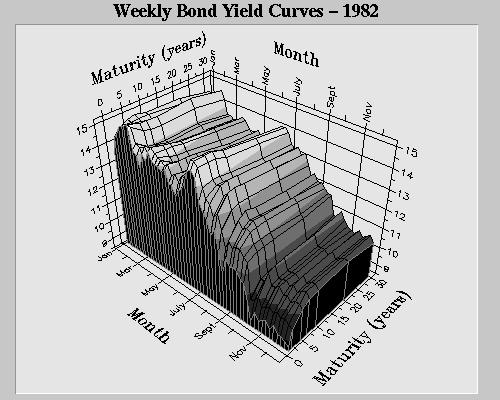
Rotating, Zooming, Scaling
End-users can easily rotate, zoom or scale Olectra Chart 3D graphs by dragging the mouse on the graph. Your users will be able to rotate around a specific axis, and view a special preview cube or the entire graph as they rotate.
The Power of Object-Oriented Properties
Developers and end-users easily manipulate charts and graphs with Olectra Chart's powerful object-based API.
Ultimate 3D Charting
"We found that Olectra Chart
has features the competition
couldn't touch. Its fast
performance and overall
flexibility are unmatched.
The built-in zooming and
rotation features provided
us with functionality we
didn't think possible."
Kevin Koenig,
Director of Development,
StonyBrook Software
- Object-Based Design
- Over 90 objects are included in the 3D Control (axis, legend, etc.).
- Data
- May come from any source, be updated at any time and may be any size. Z-value grids may be regular or irregular and can contain missing values (holes).
- Axis
- You specify the values or use the default values for X-, Y- and Z-axes minimums and maximums. Alternatively, you specify the chart labels corresponding to rows and columns in the data, or label specific points along an axis.
- Chart Labels
- Multi-line chart labels are unlimited, use as many as you need to annotate important points, and attach to a 3D grid index, a 3D point or a pixel. Interaction: Select the built-in zoom, rotate and scale, or turn it off. User interaction methods tell you exactly where the user is pointing so you can design drill-downs.
- Data Sampling and Thinning
- Routines for both sampling and thinning are included.
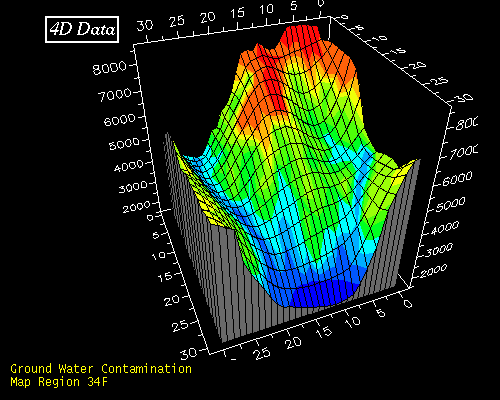
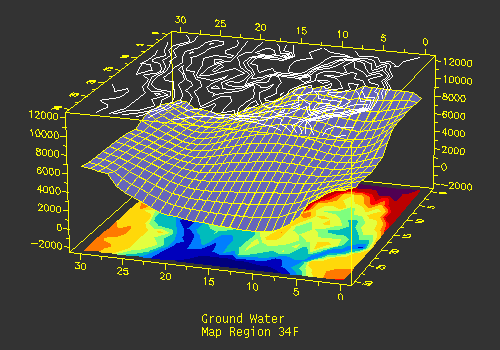
- 4D Chart
- You can create a 4D chart by draping the shading from one dataset over the surface defined by another dataset.
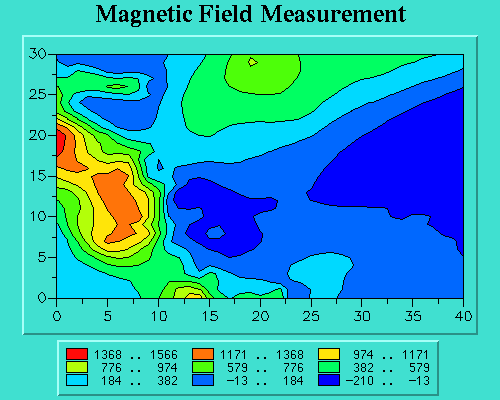
- Zone and Contour Styles
- Specify your own zoning and contouring styles (e.g., make every 5th contour level a thick, red dashed line).
- Customize Distribution
- Override the built-in linear distribution method with your own.
Technical Support
"Your dedication to customer satisfaction is outstanding."
Alan S. Cooper, Consultant
Order Your Copy Today
A trial version is also available from our web site at http://www.klg.com