 Create a report with Access's Report Wizard
Create a report with Access's Report Wizard
|
Tip In Access 7 or Access 8, it's pretty easy to create a summary report with the Report Wizard. The trick is to figure out just what to do in each of the Wizard's steps. I'll walk you through an example that creates a report totalling expenses by categories. Expense amounts are stored in a table called Expense Details, and the names of the expense categories are stored in the Expense Categories table. To follow along, use Access's Expense template to create the tables in Figure 1. 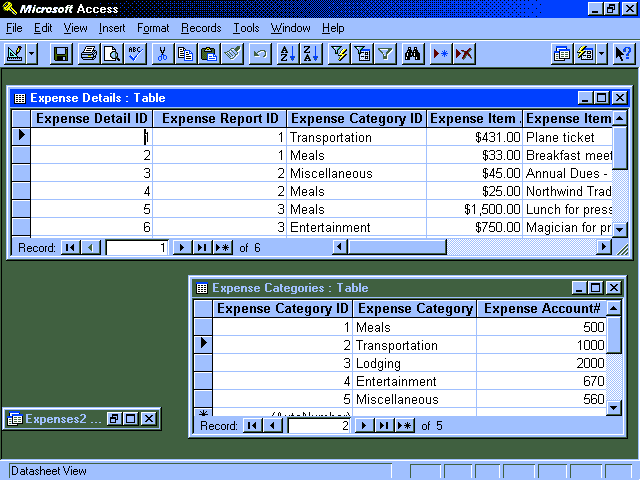 Figure 1 Our report will show several pieces of summary information: the count of records for each expense category, the sum of the expenses for each category, and the sum of expenses as a percentage of the total report dollars. Click the Reports tab in the Database window and then click New. In the New Reports dialogue box, click Report Wizard, select Expense Details in the drop-down list at the bottom of the dialogue box, and click OK. Select the fields for your report in the first Wizard step. Select Table: Expense Categories in the Tables/Queries drop-down list and add ExpenseCategory to the Selected Fields list. Next, select Table: Expense Details in the Tables/Queries drop-down list, and add ExpenseAmount and ExpenseDate to the list. Click Next. In Step 2, the Wizard asks how you want to view the records in the report ? that is, how you want the records grouped. For this example, select by Expense Categories because we want to show the number of records, the total sales, and the percentage of total sales for each category. In Step 3, the Report Wizard asks you for additional grouping fields. You can also determine how a field's values should be grouped. For example, instead of grouping a date field by individual dates, you can sort by year, quarter, month, and so on. There are different options for grouping other types of fields. To change the default grouping, click Grouping Options after you select additional grouping fields. Don't worry about setting up a group just to sort; you'll get a chance to choose sorting fields in the next dialogue box. Since we don't show summary fields for any groups here other than ExpenseCategory, click Next without adding groups. Step 4 is more involved. For the first sort field, select ExpenseDate; don't click Next just yet. Click the Summary Options button to open the Summary Options dialogue box (Figure 2). 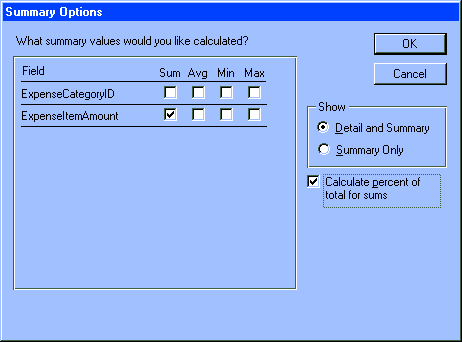 Figure 2 As you can see, it has boxes for calculating the sum, average, minimum, or maximum value of any numeric field. There is no option for counting records because the Wizard automatically adds a summary field for this in each group. In our example, the Wizard shows the number of records for each expense category. Check the Sum box for the ExpenseItemAmount field, check Calculate percent of total for sums, click OK, then click Next. In the following steps, select Stepped for the layout and Formal for the style. Enter the report title Expenses by Category, then select View?Report Design from the menus. Now let's do some work on the report so that it looks like Figure 3. First, change the name of the summary field the Wizard placed to show record counts by category: Summary for 'Expense CategoryID' = 1 (3 detail records). Double-click the field to open its Property menu, then click the Control Source line and press <Shift>-<F2>. Change the contents in the Zoom window to =Count(*) & " " & IIf(Count(*)=1,"detail record","detail records"). This tells Access to show the number of records for the category, followed by the term 'detail record' or 'detail records'. Click OK. 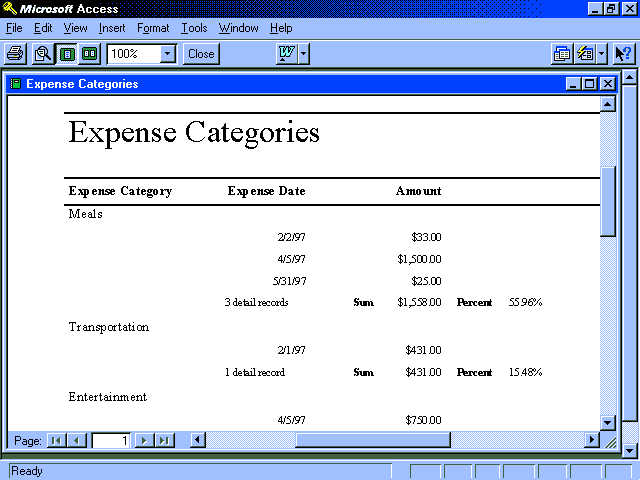 Figure 3 Next, let's rearrange the objects in the group footer. Drag the labels and text boxes up and resize them to look like Figure 3. Then drag the bottom border of the group footer up to save some white space on the printed page. - Celeste Robinson | Category: Data management Issue: Jul 1997 Pages: 178-180 |
These Web pages are produced by Australian PC World © 1997 IDG Communications