 Combo line and bar charts in Excel
Combo line and bar charts in Excel
|
Tip Suppose you have a worksheet like the one shown below: 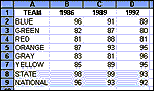 You want to display the team data (rows 2 through 7) as bars, and the state and national norms (rows 8 and 9) as lines. You use the Chart Wizard, which has four steps: select Combination in step 2, select Rows as the data series in step 4, and then specify one row for the X-axis labels. But evidently a bug in Excel prevents you from using the Format--Line Group command to change the chart type of a single series. Use this work-around: begin by creating a columnar bar chart of all the data, instead of a combination chart. Then, if your chart is on a chart sheet, select it; if it's embedded, double-click to edit it. If the Chart toolbar is not visible, select View--Toolbars, then Chart and click OK. Now, select the column for the state series, click the scroll button on the Chart Type tool, and click the Line tool, as in the figure. Voila! You've just transformed the bars for state data into a line. Repeat the steps for the national data series. 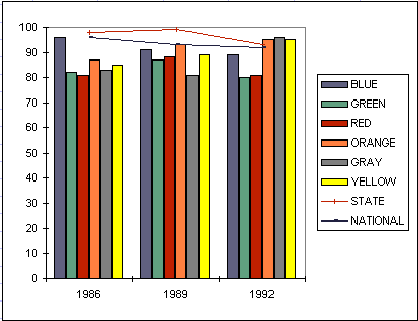 - Richard Scoville | Category: Spreadsheet Issue: Apr 1997 Pages: 176 |
These Web pages are produced by Australian PC World © 1997 IDG Communications