|
|
Calculation Investigation
Days needed 1
Grade Level 11 - 12
Objective
In this activity, students will learn how white light,
such as that from an overhead projector, is broken up into its
component colors by a diffraction grating. They will then learn the
relationships between light's wavelength, frequency, and energy and how to
convert between any of these characterizations of a particular color of
light. Background information includes general information on the
electromagnetic spectrum and the nature of light.
|
Science and Math Standards
| NCTM |
NSES |
Content Standard 1:
- Mathematics as problem Solving |
Content Standard B:
- Structure of Atoms
- Light, heat, energy and magnetism |
Content Standard 2:
- Mathematics as Communication
| |
Content Standard 4:
- Mathematical Connections |
|
Content Standard 6:
- Functions |
|
Pre-requisites
Introduction
Light can be described in many ways, by its energy, its wavelength, or its
frequency. All three terms are equally important, and all are interrelated.
Each color in the spectrum, for example red, has a distinct energy, but
also has a specific wavelength and frequency. The convention is
that infrared light and visible light (the rainbow of colors our eyes can see)
are usually described by wavelength, radio waves in terms of frequency,
and high-energy X-rays and gamma-rays in terms of energy. This scientific
convention allows the use of the units that are the most convenient for that
energy of light. For example, it would be inconvenient to describe both low-energy radio waves and high-energy gamma-rays with the same units because the
difference between their energies is so great. A radio wave can have an
energy on the order of 4 x 10⁻¹⁰ eV, as opposed to 4 x 10⁹ eV for gamma-rays. That's an energy difference of 1019, or
ten million trillion, eV!
|
Engagement
Using the overhead projector, prism, diffraction grating, and two sheets
of cardboard, the students will set up the apparatus as illustrated below to
project the spectrum of white light on a screen.
Students will then pose questions about what they are observing, and what
they are going to do to answer these questions.
Using an Overhead Projector to Project a Spectrum
We (and two of our teacher interns) have tried this recently. We had very
good success with the overhead projector method of generating a good, large
spectrum. This idea was originally published by Dr. Philip M. Sadler
in the article "Projecting Spectra for Classroom Investigations,"
The Physics Teacher, 29(7), 1991, pp. 423-427.
You will need:
an overhead projector and a source of power
two or three books or pieces of 8x10 dark construction paper
diffraction grating - (a film with thousands of microscopic grooves
per inch that break up white light) - this is available from Edmund
Scientific. Use one about the size of a 35mm slide.
white wall or screen
|
1) To make a visible light spectrum, plug in the projector, and turn
on the lamp. Set up the projector so it is projecting at a white screen or
wall.
|
2) Use books on the base plate of the projector to completely block all but a
single slit of light no larger than an 1" wide from being
projected on the screen. Focus the projector.
|
 Set-up for the experiment, including the
overhead, books to create a slit of light, and the diffraction grating
(at top of overhead)
Set-up for the experiment, including the
overhead, books to create a slit of light, and the diffraction grating
(at top of overhead)
|
 Close-up of creating the slit of light
from the overhead.
Close-up of creating the slit of light
from the overhead.
|
|
3) Place a diffraction grating over the lens at the top of the "projection
stack". Rotate the grating (if necessary) until the spectrum appears on
both sides of the projected slit on the wall or screen.
|
4) Turn off the lights, lower blinds, whatever you can do to make the room
dark. You should now have a nice spectrum projected onto the screen/wall.
|
 Close-up showing the placement of the
diffraction grating on the overhead lens.
Close-up showing the placement of the
diffraction grating on the overhead lens.
|
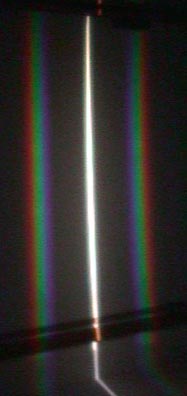 The image on the screen shows the central
white band of light coming from the projector, plus a spectrum on both
sides.
The image on the screen shows the central
white band of light coming from the projector, plus a spectrum on both
sides. |
Exploration
Print out the Student
Worksheet for the class. Have the students complete it.
Student
Worksheet
Solution for Student
Worksheet
Evaluation
Formative assessment and observation should be evident throughout the
lesson. The worksheet, final questions during closure or a future quiz may
serve as summative assessment.
Closure
If students have been keeping a lab journal, direct students to write
for ten minutes in their journals summarizing the lab and all procedures
in this lesson. Encourage students to then share
their findings and what they might have written in their journals. Otherwise,
have students create a lab report for this lesson, summarizing their
findings. The
format of the lab report would then be up to the teacher.
Extension
Using a supply of diffraction gratings, students can make their
own spectroscope (either making "spectroscope glasses" using two
gratings or a "spectroscope telescope" using one grating and a
hollow tube). Students can then look at different light sources.
(Caution students that they should not look a the sun !)
Back to the Main Spectra Unit Menu
|