
OpenGL Profiler is the Apple developed, best of class, tool to assist developers in debugging and optimizing their OpenGL usage. The following gives and overview of some of the tools the OpenGL Profiler provides which allow developers to investigate all aspects of an OpenGL client application.
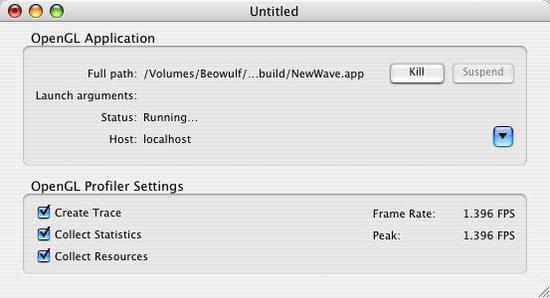
Main Window
The Profiler main panel controls tracing, collection of resources (textures and programs) and statistics. It is also a convenient place to view a client’s frame rate.
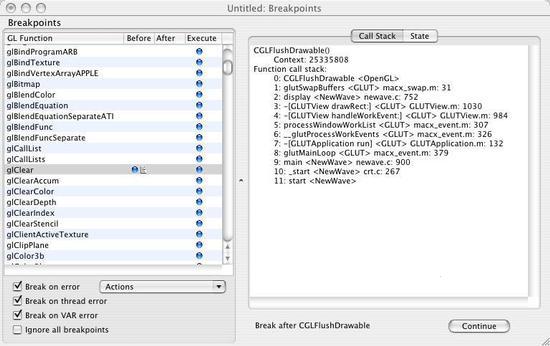
Breakpoints Window
The breakpoints window allows developers to control execution of their application and view both call stack and full OpenGL state at any breakpoint. This window is also the interface to attaching scripts to OpenGL calls.
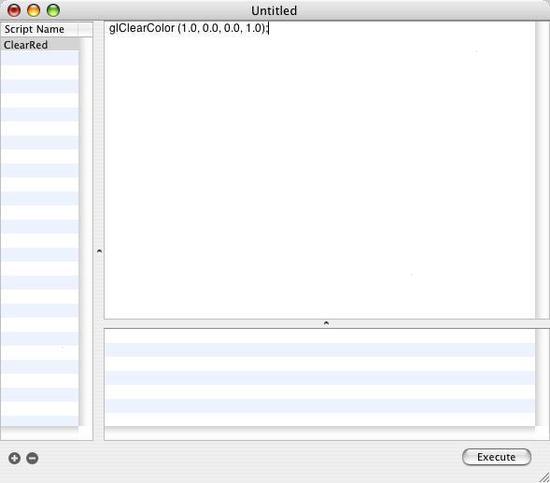
Scripts Window
You can create scripts in the scripts window which can then be attached to breakpoints, allowing developers to modify an application’s behavior for fast debugging and performance evaluation.
Application Window
Results of scripts are displayed in the client’s OpenGL window. In this case, we can see that attaching the script to change the clear color to red prior to every execution of glClear modifies the running application to have a red background color.

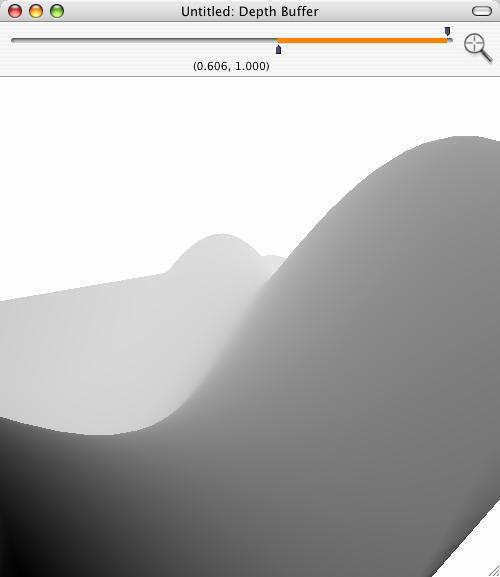
Depth Buffer Window
One can further investigate a client’s behavior when stopped at a breakpoint by analyzing its buffers. In this case we can view the depth buffer and auto-scale the gray scale window to current extents of the depth range.
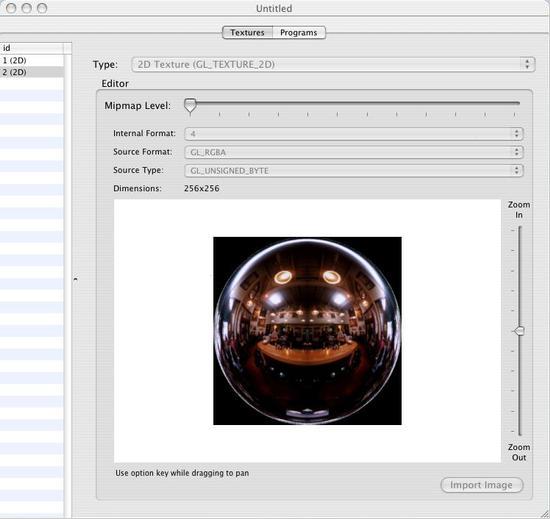
Resources Window
The OpenGL Profiler can also capture texture and program resources for viewing. Here, a 256x256 2D texture with texture ID 2 is shown.
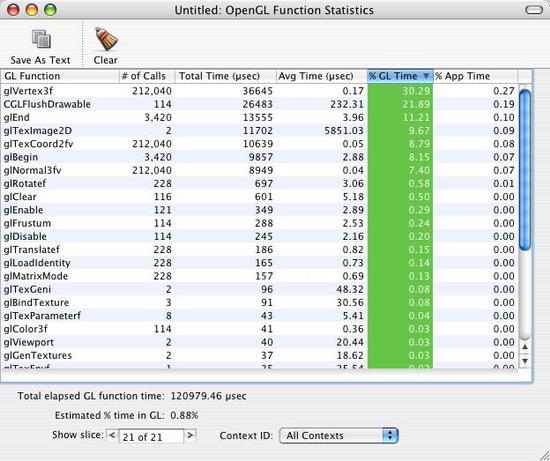
Statistics Window
One very powerful feature of the OpenGL Profiler is that it allows developers to tune for optimal performance with OpenGL on Mac OS X. The statistics window allows viewing of execution timings and other statistics for all OpenGL function calls made by the client application. In addition, time spent in these calls is compared to total application time, providing invaluable insight into the inner workings of OpenGL clients.
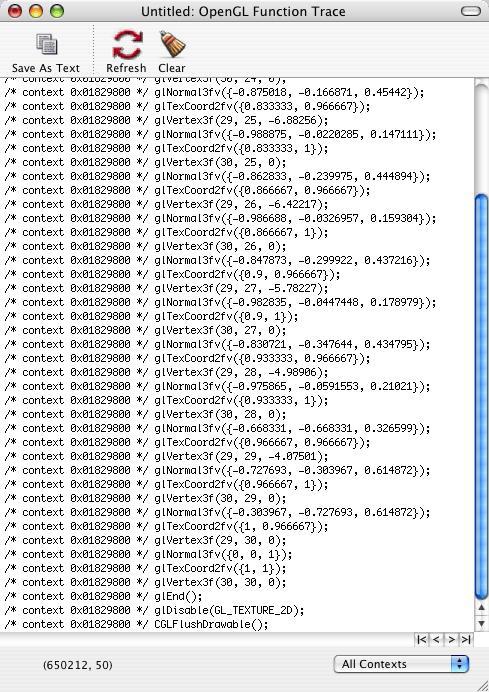
Trace Window
Developers can continue to analyze a client’s performance by capturing a trace of every OpenGL call issued, allowing debugging and optimization of critical sections of code in order to achieve optimal performance.
Updated: 2004-09-02
|