
Apple has embraced OpenGL, the cross-platform 3D graphics technology, as a key component of Mac OS X from the start. Through its continued commitment to OpenGL and its investment in OpenGL development tools, Apple has made the Macintosh the platform of choice for OpenGL developers. Mac OS X supports advanced OpenGL features such as programmable shading pipelines, allowing developers to stay on the cutting edge of 3D graphics technology, and Apple's best-of-class OpenGL tools help developers maximize performance and stability.
This article introduces you to the powerful features of the OpenGL development tools included with Mac OS X v10.3 Panther. If you have OpenGL applications, or if you are thinking about using OpenGL in your apps, this article guides you through the use of these OpenGL tools and how they can help you better analyze and optimize your application. It assumes you possess a general knowledge of 3D graphics development and that you have a familiarity with the OpenGL library (See the ADC OpenGL page for more information.)
Every copy of MacOS X v10.3 Panther ships with the Xcode Tools, which includes the OpenGL tools. The latest version of these tools is available for download by ADC members when you log in to the Apple Developer Connection Member Site.
Once installed, the OpenGL development tools are found on the system volume in the directory /Developer/Applications/Graphics Tools/. The tools covered in this article are: OpenGL Profiler, OpenGL Driver Monitor, and OpenGL Shader Builder.
OpenGL Profiler
The OpenGL Profiler is the most approachable application in the OpenGL tool suite. It monitors a running OpenGL application and collects a variety of data pertaining to the application's use of the OpenGL library, such as function call frequency and performance overhead. It also has the ability to suspend an application and display the frozen state of the OpenGL machine, the frame buffer, and any loaded texture maps. In general, the OpenGL Profiler provides a window through which you can peer inside an application in its running state to observe its true interaction with OpenGL. This can provide significant benefits for both performance optimization and debugging purposes.
Reading the OpenGL Function Trace
The OpenGL Profiler can collect a function trace that records every OpenGL function called by an application. Each function call is listed along with the parameter values passed to it. Where possible, parameter values are conveniently resolved into their corresponding OpenGL enumerant names to allow easier interpretation of the data.
In addition to core OpenGL functions, the trace recognizes functions defined by every supported extension and function belonging to the CGL library, as shown in Figure 1. The CGL library is the operating system interface used to manage OpenGL contexts and interprets context-related commands from the higher layers: AGL (for Carbon applications) and NSOpenGL (for Cocoa applications).
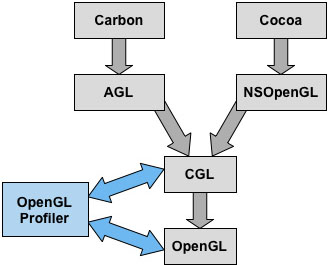
Figure 1: The OpenGL Profiler interacts with both the OpenGL library and the CGL library.
More information about these components can be found in Technical Q&A QA1269, Mac OS X OpenGL Interfaces.
Examination of the trace gathered from an application immediately exposes suboptimal situations in which there may be redundant, excessive, or unnecessary OpenGL function calls. The presence of function calls that duplicate or undo the affect of previous function calls can degrade OpenGL performance significantly, and the function trace can help identify these occurrences.
As an example, suppose you discover that a rendering state is enabled (using the glEnable() function) and subsequently disabled without any intervening drawing commands. In this case, the pair of function calls has no net effect and both can be eliminated.
In one real-world case, a graphics application had been iterating through several enabled texture units to update texture state before rendering. Sometimes, no state needed to be changed for a particular texture unit, but the application was still calling the glActiveTexture() function to select it. For this developer, running the OpenGL Profiler and collecting a trace quickly highlighted these superfluous function calls, and the application gained an optimization.
Another thing that the trace can do for you is facilitate OpenGL function call debugging. For instance, expected function calls missing from the trace may indicate to a programmer that a particular section of code is not being executed in the intended manner. Also, examination of the actual values passed as parameters to OpenGL functions may reveal that the source of a problem lies in incorrect data being sent to the rendering pipeline.
Whereas the function trace provides a low-level view of the interaction between an application and the OpenGL library, a broader picture can be acquired using the statistics collection feature of the OpenGL Profiler. Statistics are gathered and organized into a table that shows the number of times each OpenGL function is called and how much time was spent handling those calls. The table is frequently updated as the targeted application continues to run and may be sorted according to any of the displayed quantities. A quick inspection of the statistics can give you a good idea about where processing time is spent, enabling concentrated optimization where the greatest return on effort can be achieved.
Collecting OpenGL Resources
Another information-gathering feature of the OpenGL Profiler is its ability to collect resources loaded by a running application. Any texture image, vertex program string, or fragment program string specified by an application can be captured by the profiler and examined, allowing you to visually ensure the integrity of the data passed to the OpenGL library. Each collected resource is displayed with the object ID assigned to it at the time it was loaded into OpenGL. This enables you to extract the parameter values from a resource-loading function observed in the function trace and find the associated texture image or program string.
Texture maps for any of the supported targets (1D, 2D, 3D, RECT, and CUBE), including any existing mipmap images, are displayed in a viewport alongside information such as the dimensions of the texture, the format of the source image data, and the internal format in which the OpenGL library has stored the texture. Three-dimensional and cube map textures are conveniently applied to an actual cube that can be rotated with the mouse. The program strings that may be collected and displayed correspond to the GL_ARB_vertex_program, GL_ARB_fragment_program, and GL_ATI_text_fragment_shader extensions to OpenGL.
Suspending Execution of an OpenGL Applications
In addition to the debugging potential produced by the aforementioned features, the OpenGL Profiler has the ability to trap any set of OpenGL functions and suspend execution of an application before or after any of the functions is called. The OpenGL Profiler extends standard breakpoint functionality beyond what can be achieved using a general-purpose debugger. As shown in Figure 2, the OpenGL Profiler provides the means to set breakpoints at the beginning or end of any OpenGL function call. Furthermore, you can attach a script to any such breakpoint that is executed each time a particular function is encountered. This is useful for applying OpenGL state modifications that may provide clues to the cause of undesired behavior.
Breakpoints may also be set to trigger whenever certain types of errors occur. While an application is suspended due to an explicit breakpoint or an error condition, you can examine the current call stack and the absolute entirety of the current OpenGL state machine, including the current contents of the frame buffer. Separate windows can be opened to display the contents of the color buffer, alpha buffer, depth buffer, and stencil buffer. Being able to see the buffers that are not normally shown enables visual debugging of certain graphics algorithms. For example, the alpha buffer is often used to store intermediate data in multiple-pass rendering algorithms, and stencil buffer methods exist for generating highly accurate shadows.
You are encouraged to employ the OpenGL Profiler throughout the development process of a 3D graphics application. Regularly lifting the hood and tuning the engine has countless benefits that can help eliminate performance bottlenecks, preemptively squash bugs that may be hiding in dark corners, and generally make an OpenGL application run more smoothly.
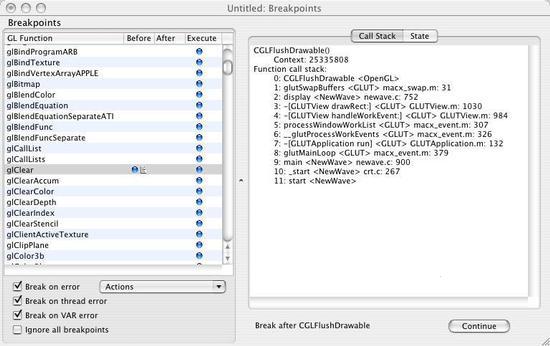
Figure 2: The OpenGL Profiler Breakpoints Window.
OpenGL Driver Monitor
For those engineers who like to be closer to the metal, the Graphics Tools include the OpenGL Driver Monitor. This tool is capable of monitoring a large set of low-level statistics that pertain to the operation of the GPU (Graphics Processing Unit). In contrast to the OpenGL Profiler, the statistics collected by the OpenGL Driver Monitor reflect the combined activity of all OpenGL applications running on the host computer, including Quartz Extreme if it is supported by the graphics hardware.
The types of data that the OpenGL Driver Monitor can gather from the GPU in real time include VRAM usage, AGP bus traffic, hardware stalls, and many others. As demonstrated in Figure 3, any number of variables can be selected and concurrently graphed to obtain a picture of graphics driver performance characteristics. With this information, it is often possible to identify the cause of temporary slowdowns or sporadic hesitations they may be plaguing an otherwise well-behaved OpenGL application.
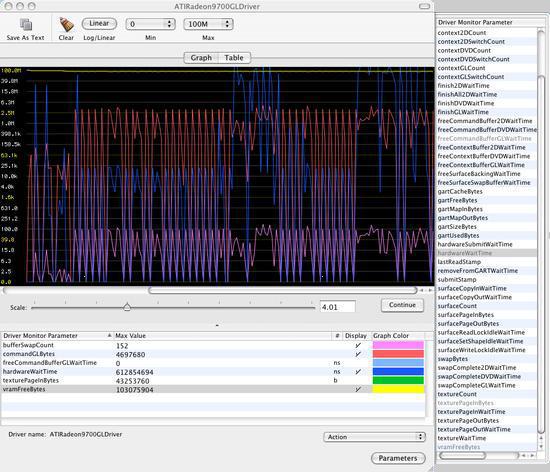
Figure 3: The OpenGL Driver Monitor.
The following table lists some of the most useful parameters that can be watched by the OpenGL Driver Monitor. Most parameter values are reset at regular sampling intervals (usually one second) and thus represent a varying rate of some kind. All time measurements are expressed in nanoseconds.
| Parameter Name |
Description |
hardwareWaitTime |
The amount of time the CPU stalled while waiting on the GPU for any reason. |
hardwareSubmitWaitTime |
The amount of time the CPU stalled while waiting to be able to submit a new batch of commands to the GPU. |
clientGLWaitTime |
The amount of time the CPU stalled while the client (user level) OpenGL driver waited for a hardware timestamp to arrive (usually for making texture modifications or waiting for a fence to complete). |
swapCompleteGLWaitTime |
The amount of time the CPU stalled waiting for a previously issued OpenGL buffer swap to complete. |
finishGLWaitTime |
The amount of time the CPU stalled waiting for all OpenGL commands issued on a single context to complete. This is essentially the time spent in the glFinish() function. |
surfaceCount |
The total number of surfaces allocated by the GPU. This is not reset for each sample, but represents the absolute total. |
textureCount |
The total number of kernel textures allocated by the GPU. This is not reset for each sample, but represents the absolute total. |
texturePageInBytes |
The number of bytes transferred to VRAM for texture page-ins. Textures mapped via AGP do not show up here. |
gartUsedBytes |
The total number of bytes mapped into AGP GART (Graphics Address Remapping Table). |
gartMapInBytes |
The number of bytes mapped into the AGP GART. |
gartMapOutBytes |
The number of bytes unmapped from the AGP GART. |
For the meanings of these parameters, see Technical Q&A QA1334, OpenGL Driver Monitor Decoder Ring.
OpenGL Shader Builder
With the advent of highly programmable GPUs, 3D graphics application developers have unprecedented flexibility in terms of vertex and fragment processing for hardware-accelerated rendering. The calculations performed at each vertex or pixel are defined by short assembly-like programs, commonly called shaders, whose syntax and function are defined by the GL_ARB_vertex_program, GL_ARB_fragment_program, and GL_ATI_text_fragment_shader extensions. To assist you in the creation of complex shaders, Apple provides the powerful and useful OpenGL Shader Builder tool.
As shown in Figure 4, the OpenGL Shader Builder lets you type in a vertex program and fragment program, specify texture maps and parameters for each of the available texture units, and immediately see how the surface of a preview geometry is rendered. Whenever possible, the preview geometry is updated with literally every keystroke, providing instantaneous and continuous feedback as a program is being entered. If the preview geometry cannot be updated because an error exists in the program, then the location of the error is immediately identified. As a program is being written, the usage of available program resources, such as the number of instructions or temporary registers, is updated so that you are constantly aware of how close you are to the hardware's limits.
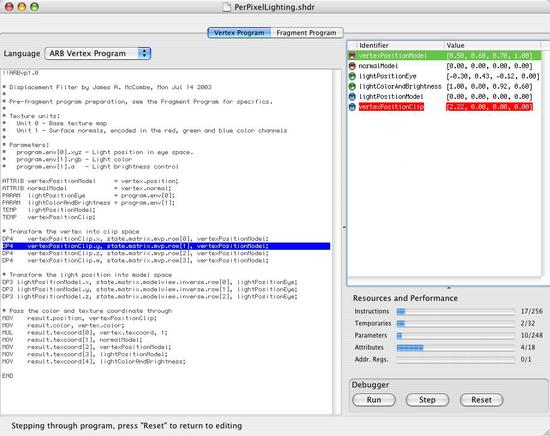
Figure 4: The OpenGL Shader Builder analyzes a vertex program or fragment program as it is being entered and displays current resource usage.
In addition to simply displaying a shader's end result, the OpenGL Shader Builder can be used as a debugging tool. You are able to step through vertex programs and fragment programs one instruction at a time in order to scrutinize the internal register values as a program runs. The values of program parameters, attributes, and temporary variables are updated at each step and can be modified if desired. The OpenGL Shader Builder provides the only means by which this type of debugging can be accomplished.
For those developers who don't always have a copy of the official specifications handy, the OpenGL Shader Builder includes an instruction reference for all three types of programs that it supports. Another convenient feature allows completed shaders to be exported into Xcode projects. These extras just add to the already extensive utility of this tool, which ought to be the target of an alias on every serious OpenGL developer's Mac OS X desktop.
For More Information
Posted: 2004-02-02
|