Next | Prev | Up | Top | Contents | Index
Performance Tuning Tools
IRIX provides several tools that you can use to optimize the performance of your application. Table 5-2 summarizes these tools and the paragraphs following the table describe each tool in greater detail.
Summary of Performance Tuning Tools
| Name of Tool | Function |
| prof | Measures the amount of time spent in various parts of a program--used in conjunction with the -p compiler driver option. |
| pixie | Counts the number of times basic blocks in a program are executed--used in conjunction with the prof program. |
| par | Traces system calls and scheduling activity. |
| cord | Rearranges procedures in your program to reduce paging and reduce instruction cache mapping. |
| xscope | Monitors connections between an X server and a client. |
Using prof and pixie
You can use the profiling tools prof and pixie to find areas of your program where most of the execution time is spent. With this information, you can concentrate your effort on improving code efficiency in these parts of the program. The profiling tools provide two kinds of information:
- Program counter (pc) sampling, which measures the amount of execution time spent in various parts of a program. It does this by interrupting program execution every 10 milliseconds and recording the value of the program counter.
- Basic-block counting, which counts the number of times each basic block executes. A basic block is a region of the program that can be entered only at the beginning and exited only at the end.
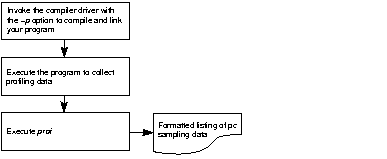
To obtain pc sampling data, specify the -p compiler driver option when you prepare your program for execution. A program prepared using this option produces pc sampling data during program execution. To view the pc sampling data, run the prof program. prof analyzes the data files generated during program execution and produces a formatted listing.
Figure 5-1 shows the steps necessary to get pc sampling information.

Figure 5-1 : Using prof to Obtain pc Sampling Information
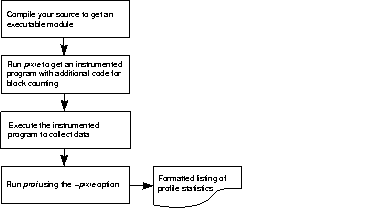
To obtain block counting information, use the pixie program. pixie reads an executable program, partitions it into basic blocks, and writes (instruments) an equivalent program containing additional code that counts the execution of each basic block. You can execute this instrumented program to obtain a file containing basic block counts.
To obtain a formatted listing of the block count information, run the prof program using the -pixie option. Figure 5-2 shows how you can obtain basic block counts for your program.

Figure 5-2 : Using pixie to Collect Basic Block Counts
par
The par system utility program traces system calls and scheduling activity. You can use it to trace the activity of a single process, a related group of processes, or the system as a whole. par prints a report showing all system calls made by the specified processes, along with arguments and return values.
cord
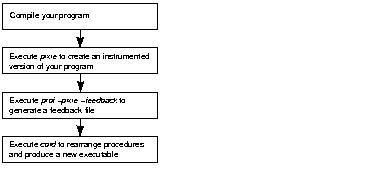
The cord program rearranges procedures in an executable object to reduce paging and achieve better instruction cache mapping. Typically, the order specified either minimizes paging or maximizes the likelihood that data items are in cache when needed. Figure 5-3 shows how you can use cord to rearrange the procedures in your program.

Figure 5-3 : Using cord to Rearrange Procedures
xscope
The xscope program monitors connections between an X server and a client. It prints the contents of each request, reply, error, or event that is communicated between the server and client. This information can be useful in debugging and performance tuning of X servers and clients.
Next | Prev | Up | Top | Contents | Index
